Examining the Role of Employer Benefits and Turnover in Center-based Child Care
BY Robyn Kelton, M.A. | June 27, 2025
By Robyn Kelton, M.A.
INTRODUCTION
Turnover rates in child care are among the highest in education, with over 160,000 workforce openings predicted annually (Bassok et al., 2014; Doromal et al., 2022; Joughin, 2021; U.S. Bureau of Labor Statistics, 2025). While some turnover is expected and even necessary, the levels of turnover experienced in the field of early childhood education and care (ECEC) are not only alarmingly high but deeply problematic. In 2021, a national survey conducted by the National Association for the Education of Young Children found that over 80% of child care centers were experiencing a staffing shortage, with the majority of those programs reporting one-to-five open roles, but 15% reporting between six and 15 open roles (NAEYC, 2021). Staffing shortages result in lost revenue, financial uncertainty, and program instability, often forcing administrators to operate below capacity and/or under reduced hours (NAEYC, 2021; NAEYC, 2024; Zero to Three, 2024). Limited enrollment slots and classroom and program closures lead to increased waiting lists (Zero to Three, 2024; Carrazana, 2023). In turn, families are placed in a highly vulnerable position of needing to leave the workforce to stay home with their child or turn to potentially unsafe or unregulated child care. Moreover, increased turnover in classrooms interrupts continuity of care and disrupts the relationships built between children and their educators (Reidt-Parker, J., & Chainski, M. J. (2015).
Research has begun to highlight some of the programmatic and personnel characteristics predictive of increased staff turnover in ECEC programs. Low wages are most commonly identified as a strong predictor of turnover (Amadon et al., 2023; Bryant et al., 2023; Fee, 2024; Guevara, 2022; Totenhagen et al., 2016). However, workforce advocates and some researchers have begun to expand conversations on compensation to explore the impact the profession’s general lack of benefits such as paid time off, access to health insurance, and retirement benefits has on retention (e.g., Amadon et al., 2023; Bryant et al., 2023; Fee, 2024; Lucas, 2023). While informative, this body of work has typically approached benefits as binary variables (i.e., have or do not have) rather than reflect the spectrum on which benefits are commonly offered (e.g., the number of days off, the percent of insurance covered by the employer, and levels of retirement matching funds).
This Research Note aims to expand on previous work investigating the relationship between benefits and turnover by exploring the possibility of a more nuanced relationship between the variables to determine if the level of benefits offered impacts turnover rates.
METHOD
This study used data collected via formal Program Administration Scale, 3rd Edition (PAS-3) assessments conducted by Certified PAS-3 Assessors between 2023 and 2025. To become certified, PAS-3 assessors must first achieve reliability (a score of at least 86%) on a test conducted after four days of training on the tool. Next, they must conduct two PAS assessments within three months of reliability training. PAS-3 national anchors reviewed the completed assessments for consistency, accuracy, and completeness. The study analyzed data from 133 PAS-3 assessments collected during the certification process across 12 states, the District of Columbia, and the U.S. Mariana Islands.
Measures
Data for this study were collected using the PAS-3, a valid and reliable tool used to measure and improve Whole Leadership practices in center-based programs (Talan, Bella, Jorde Bloom, 2022). The PAS-3 includes 25 items, each composed of 2-5 indicator strands and scored on a 7-point Likert scale (1 = inadequate, 3 = minimal, 5 = good, and 7 = excellent). Item scores are averaged to determine a mean PAS-3 score.
Of particular interest to this study is Item 5: Benefits. Item 5 measures employee access to health insurance and considers what percentage of the cost is paid by the employer, the total number of paid time off days within the first and fifth years of employment, access to a retirement plan, and the percentage at which the employer will match the employee’s contribution. Last, Item 5 explores provisions made to cover the costs of staff’s professional development. Non-applicable is allowed as a response for indicators related to health insurance and retirement if there are no full-time staff employed by the program.
Sample
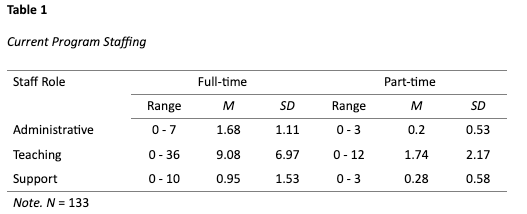
Program enrollment ranged in size from four children to 285, with a mean enrollment of 65 and a median of 55. Total program staff for the sample ranged from two to 44 staff, with an average of just under 14 staff (13.93) and a standard deviation of 8.80. Table 1 below provides a detailed breakdown of staff by role and full-time and part-time status.
Seventy percent of the programs served infants, 81% served toddlers, 92% served preschoolers, and 47% served school-age children. Thirty-eight percent of the programs offered part-day programming, 71% offered full-day, and 40% offered before and after-school programming. Over half (57%) of the programs were for-profit, and 43% were not-for-profit. Only 14% of the programs reported receiving Head Start funding, and 30% reported receiving State Pre-K funding. Figure 1 below provides a breakdown of program auspices.
FINDINGSEleven percent of the programs were nationally accredited. PAS-3 assessment scores ranged from 1.04 to 5.92, with an average of 3.36, a median of 3.46, and a standard deviation of 1.19.
FINDINGS
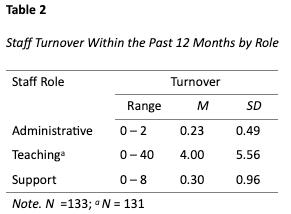
First, descriptive statistics were used to explore average PAS-3 item scores and program turnover rates. The average score for Item 5: Benefits was 1.92 (SD 1.65), demonstrating that access to benefits was below what is considered a minimal level of quality according to PAS-3 benchmarks (Talan, Bella, & Bloom, 2022). Turnover within the past 12 months ranged from zero to 41, with a mode of 2, and an average of 4.53 staff departures (SD = 5.88) per center. Turnover percentage rate was calculated by dividing the total number of staff who had left the program within the previous 12 months by the current number of staff. Center turnover ranged from 0% to 164% (e.g., high staff turnover in small programs) with an average of 33% and a median of 23% (SD = .32). Table 2 provides a detailed breakdown of turnover by role.
The Relationship Between Turnover and Benefits
Bivariate analysis revealed that centers offering more comprehensive benefits (higher Item 5 scores) tended to have lower staff turnover rates. This relationship was statistically significant, meaning it is unlikely to be due to chance (r = .24, p = .005). Next, correlations were run at the indicator level to determine which of the 22 indicators had the strongest relationship to turnover.
Health Insurance. Just over half (52%) of centers offered full-time staff the option to purchase health insurance with some employer contribution. Of those, 38% percent of the programs offered health insurance with the employer paying at least 50% of the costs. Only 27% of programs covered at least 66% of the cost, and at this threshold, turnover rates were significantly lower (r = -.20, p < .05).
Paid Time Off. Just over half (53%) of the programs provided all employees 11 days of paid time off in the first year. After their fifth year of employment, only 28% of programs offered all staff 24 days of paid time off, and 19% offered 32 days of paid time off. Programs offering at least 24 or 32 days by the fifth year saw significantly lower turnover (r = -.27, p <.005 and r = -.23, p <.05, respectively).
Retirement. Just over half (56%) of the programs in the sample offered all full-time employees the option of contributing to a retirement plan, 41% of programs did not, and 2% of the programs in the sample were marked N/A because they had no full-time employees. Full-time employees having the option to contribute to a retirement plan was associated with less turnover. Although significant, the correlation was weak. (r = .17, p. <.05).
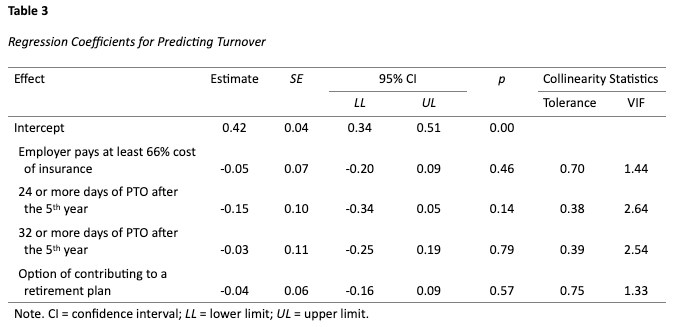
To further explore these relationships, a regression analysis was conducted to examine the combined effect of all benefits on staff turnover. The analysis found that, together, the benefits offered by a program significantly predicted turnover rates (F(3, 124) = 3.14, p <.05). The R2 was 0.09, indicating that the collective significant effect of the benefits accounted for about 9% of the variation in turnover between centers. However, no single benefit emerged as a significant predictor on its own. This suggests that the overall package of benefits, rather than any specific offering, may be most important for staff retention. See Table 3 for additional details on the regression model.
DISCUSSION
This study sought to better understand the relationship between employee benefits offered by center-based ECEC programs and staff turnover rates. The findings reinforce the growing body of research that highlights the importance of not only compensation but also benefits in retaining early childhood educators, while also providing new nuance about which aspects of benefits may matter most.
Consistent with prior studies, these results show that access to benefits in the child care sector remains limited. On average, programs in our sample fell below what is considered a minimal level of quality for benefits, and turnover rates were high, with an average annual turnover of 33%. These findings echo national concerns about instability in the early childhood workforce and the challenges faced by both providers and families.
The analysis found that, overall, programs offering more robust benefit packages tended to have lower staff turnover. Specifically, higher scores on the PAS-3 Item 5, Benefits were significantly associated with reduced turnover rates. When looking at specific types of benefits, the data revealed that more generous paid time off, higher employer contributions to health insurance, and access to retirement plans each showed significant negative correlations with turnover. This suggests that these particular benefits may be especially valued by staff and could play a role in their decisions to remain with their employer.
However, when all benefit indicators were considered together in a regression model, no single benefit emerged as a uniquely significant predictor of turnover. Instead, it was the combined presence of multiple benefits that made a difference, with the overall model explaining about 9% of the variance in turnover rates. While this may seem modest, it is notable given the complexity of factors that influence staff retention, including wages, organizational climate, leadership, and external labor market conditions.
These results suggest that efforts to improve retention in ECEC settings should focus on offering a comprehensive package of benefits, rather than emphasizing any one benefit in isolation. Programs that invest in their staff’s health and financial security, through paid time off, health insurance, and retirement options, may be better positioned to retain staff. This has important implications for policymakers and program leaders seeking to stabilize the sector and ensure continuity of care for children and families.
Despite these important findings, several limitations should be considered when interpreting the results. First, the data used in this study are cross-sectional and drawn from a convenience sample of programs undergoing PAS-3 certification, which may limit generalizability. Second, the study focused solely on benefits and did not control for other known predictors of turnover, such as wages, working conditions, leadership style, or staff demographics (Goffin & Washington, 2007; Whitebook, Phillips, & Howes, 2014; Totenhagen et al., 2016). As such, the results of this study should be interpreted as exploratory rather than causal. Future research should examine how benefits interact with these other factors, ideally through longitudinal studies that can better assess changes over time and directionality of effects.
Even with these limitations, the results of this study contribute valuable insight into how benefits, particularly when offered as a package, can support retention in ECEC settings. Programs with the capacity to invest in their staff’s health and financial well-being may be better positioned to reduce turnover and promote stable, high-quality learning environments for young children.
References
- Amadon, S., Maxfield, E., Simons Gerson, C., & Keaton, H. (2023). Health Insurance Coverage of the Center-Based Child Care and Early Education Workforce: Findings from the 2019 National Survey of Early Care and Education. OPRE Report #2023-293. Office of Planning, Research, and Evaluation, Administration for Children and Families, U.S. Department of Health and Human Services. https://www.childtrends.org/publications/provider-experiences-with-staffing-and-compensation-in-early-care-and-education
- Bassok, D., Fitzpatrick, M., Greenberg, E., & Loeb, S. (2014). Within‐and between‐sector quality differences in early childhood education and care. Child Development, 87(5), 1627–1645. https://doi.org/10.1111/cdev.12551
- Bryant, K., McCready, L. T., & Iruka, I. U. (2023). Compensation Matters: The Impact of Wages and Benefits on Early Educator Well-Being. National Black Child Development Institute. https://www.nbcdi.org/resource/compensation-matters
- Carrazana, C. (2023, September 6). Day care waitlists are so long, moms are quitting their jobs or choosing to stop having kids . The 19th. https://19thnews.org/2023/03/day-care-waitlists-child-care-strain-parenting/
- Doromal, J.B., Bassok, D., Bellows, L. and Markowitz, A.J., 2022. Hard-to-staff centers: Exploring center-level variation in the persistence of child care teacher turnover. Early Childhood Research Quarterly, 61, pp.170-178.
- Goffin, S. G., & Washington, V. (2007). Ready or Not: Leadership Choices in Early Care and Education. Teachers College Press.
- Fee, A. (2024). Using Worker Flows to Assess the Stability of the Early Childcare and Education Workforce, 2010-2022. Federal Resrve Bank of Clevland. https://www.clevelandfed.org /publications/cd-reports/2024/20240119-childcare-and-education-workforce
- Joughin, J. (2021). Our Child Care System Is Not Meeting The Needs Of Families, Providers, or The Economy.First Five Years Fund. https://www.ffyf.org/resources/2021/06/our-child-care-system-is-not-meeting-the-needs-of-families-providers-or-the-economy/
- Lucas, A. (2023). Retirement for early educators: Challenges and possibilities. Federal Reserve Bank of Boston.
- National Association for the Education of Young Children (NAEYC). (2021). Progress and peril: Child care at a crossroads. https://www.naeyc.org/sites/default/files/globally-shared/downloads/PDFs/resources/blog/naeyc_july_2021_survey_progressperil_final.pdf
- National Association for the Education of Young Children (NAEYC). (2024). Compensation Means More Than Wages: Increasing Early Childhood Educators’ Access To Benefits https://www.naeyc.org/ sites/default/files/wysiwyg/user73607/naeyc_benefits_brief.may_2024.pdf
- Reidt-Parker, J., & Chainski, M. J. (2015). The importance of continuity of care: Policies and practices in early childhood systems and programs. The Ounce.
- Talan, T. N., Bella, J., & Jorde Bloom, P. (2022). Program Administration Scale (PAS), 3rd ed. Teachers College Press.
- Totenhagen, C. J., Hawkins, S. A., Casper, D. M., Bosch, L. A., Hawkey, K. R., & Borden, L. M. (2016). Retaining Early Childhood Education Workers: A Review of the Empirical Literature. Journal of Research in Childhood Education, 30(4), 585–599.
- Whitebook, M., Phillips, D., & Howes, C. (2014). Worthy Work, STILL Unlivable Wages: The Early Childhood Workforce 25 Years after the National Child Care Staffing Study. Center for the Study of Child Care Employment, UC Berkeley.
- U.S. Bureau of Labor Statistics. (2025). Childcare workers: Occupational outlook handbook. U.S. Department of Labor. https://www.bls.gov/ooh/personal-care-and-service/childcare-workers.htm
- Zero to Three. (2024). How America’s Child Care Crisis Impacts Parents.
https://www.zerotothree.org/ resource/how-americas-child-care-crisis-impacts-parents/


