Director’s Professional Development Needs Differ by Developmental Stage
BY McCormick Center | July 18, 2018

Sim Loh is a family partnership coordinator at Children’s Village, a nationally-accredited Keystone 4 STARS early learning and school-age enrichment program in Philadelphia, Pennsylvania, serving about 350 children. She supports children and families, including non-English speaking families of immigrant status, by ensuring equitable access to education, health, employment, and legal information and resources on a day-to-day basis. She is a member of the Children First Racial Equity Early Childhood Education Provider Council, a community member representative of Philadelphia School District Multilingual Advisory Council, and a board member of Historic Philadelphia.
Sim explains, “I ensure families know their rights and educate them on ways to speak up for themselves and request for interpretation/translation services. I share families’ stories and experiences with legislators and decision-makers so that their needs are understood. Attending Leadership Connections will help me strengthen and grow my skills in all domains by interacting with and hearing from experienced leaders in different positions. With newly acquired skills, I seek to learn about the systems level while paying close attention to the accessibility and barriers of different systems and resources and their impacts on young children and their families.”
This document may be printed, photocopied, and disseminated freely with attribution. All content is the property of the McCormick Center for Early Childhood Leadership.
This resource is part of our Research Notes series.
Research suggests that many early childhood program administrators enter into leadership roles by being promoted from teaching positions and few have prior education, training, or experience specific to leadership or management (Catron & Groves, 1999; Billman, 1995; Bloom & Rafanello, 1994). Many directors of early care and education programs must navigate their own ongoing professional development and learn how to improve their leadership practice without assistance. Little attention has been given to differentiating professional learning opportunities by directors’ needs as they grow throughout their careers.
In 1997, Paula Jorde Bloom examined the perceived roles and work history of 257 early care and education program directors. She identified three developmental career stages: beginning directors, competent directors, and master directors based on self-identification. The Directors’ Role Perceptions Survey, developed for the 1997 study (Bloom, 1997, 2004), documented key differences in leadership and management practices at various developmental stages of the directors’ careers. The McCormick Center for Early Childhood Leadership recently conducted a follow-up study to examine current directors’ perceptions about their roles and to identify how their professional development needs differ by their stage of leadership development.
SAMPLE
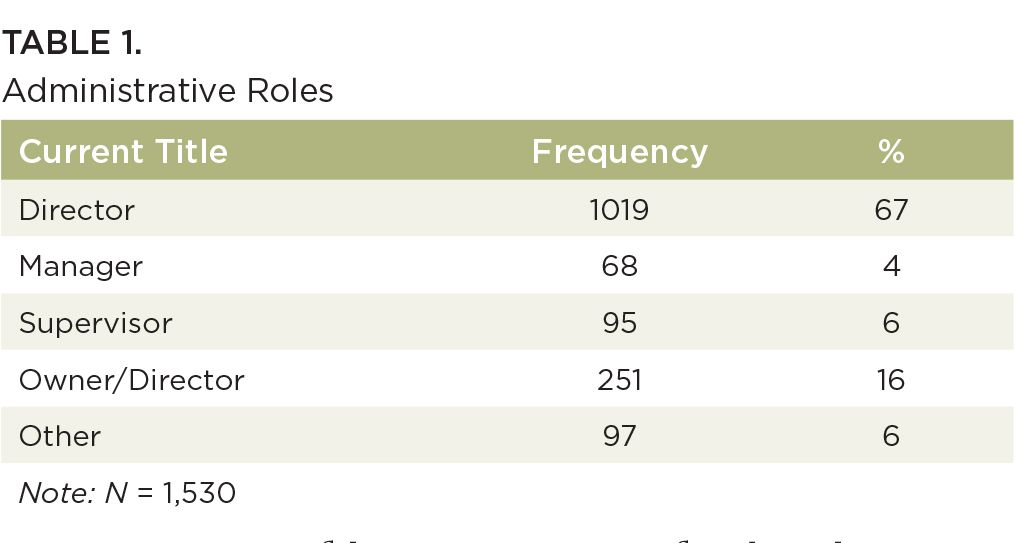
In November of 2017, a national online survey was conducted using the McCormick Center’s contact database. The sample consisted of 1,530 childhood program administrators and included respondents from 49 states and the District of Columbia. Table 1 shows the roles of survey respondents.
Ninety-six percent of the participants were female with an average age of 48, ranging from 18 to 73 years. On average, respondents had worked in the field of early childhood for 22.5 years, with tenures ranging from one to 48 years. Their tenure included an average of 13.3 years in any administrative position and 8.4 years in their current position. Of those that provided race/ethnicity information (n = 555), 79% identified as White/Caucasian, 12% identified as Black/African American, 3% identified as multiracial, and 1% identified as Native American. Eight percent of respondents identified themselves as Hispanic (n = 549).
Participants (n = 1,258) reported their highest level of education as a graduate degree (42%), baccalaureate degree (37%), associate degree (17%), and high school (7%). The majority (67%) of those with an associate degree or higher had a major in child development or early childhood education. In addition, 17% had earned the Child Development Associate (CDA) credential. Twenty-nine percent of respondents had a state issued early childhood credential and 22% had achieved a state or national director credential.
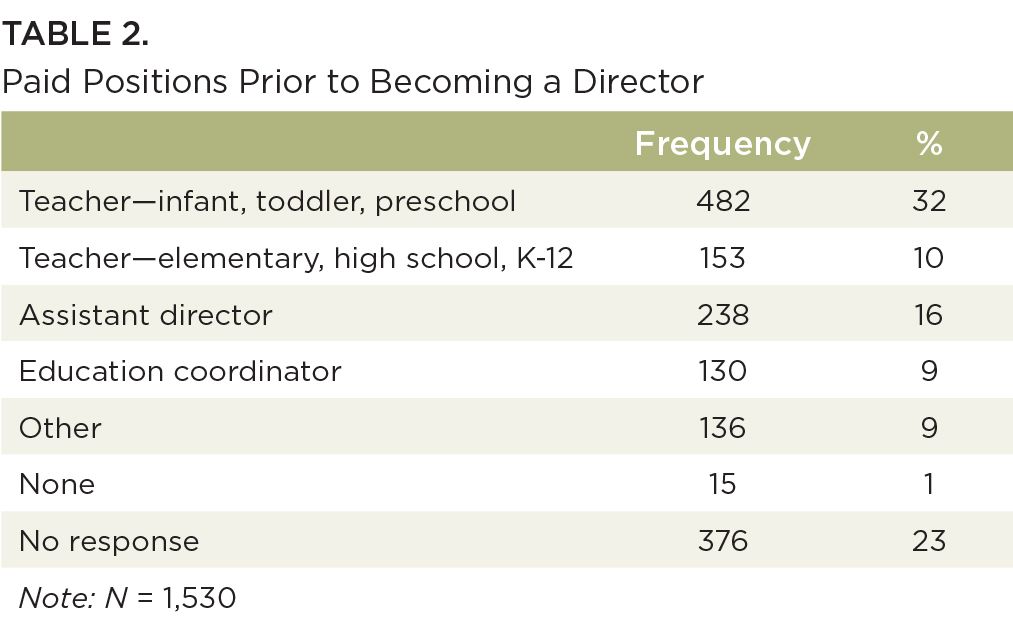
Respondents were asked to specify the types of paid positions they held prior to their current administrative role. Table 2 lists the number and percentage of participants by their work experience prior to becoming a director, with 42% of respondents indicating they had previous teaching experience and 25% reporting previous administrative experience as an assistant director or education coordinator.
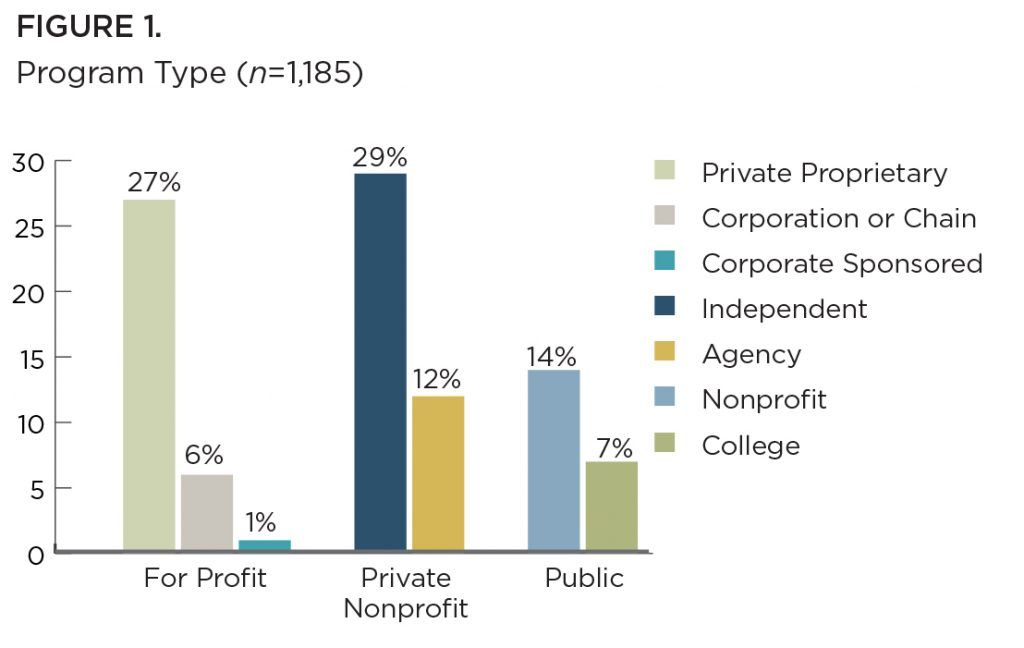
The mean current enrollment at programs where respondents worked was 121. The early childhood programs where respondents worked were well distributed among geographic regions: suburban 44%, urban 38%, and rural 18% as well as across various program types and sectors as shown in Figure 1.
METHODOLOGY
In consultation with Dr. Paula Jorde Bloom, author of the initial version of the Directors’ Role Perception Survey, researchers at the McCormick Center revised the survey to a 74-item instrument that included many items from the original survey while also adding questions related to leadership efficacy beliefs and categorizing questions according to the Whole Leadership Framework (Bella, Abel, & Talan, 2017). The survey was administered online through SurveyMonkey© and was sent to those on the McCormick Center’s email list. Data were analyzed from respondents that identified as a director (as defined in the survey), to examine various aspects about how early childhood administrators perceived their jobs. The Welch test was used to examine differences between groups of directors that perceived their career stage as novice, capable, or master. The Welch test was selected over the one-way ANOVA because the homogeneity of variance assumption was violated and because Welch provides a more robust test for equality of means.
RESULTS
Based on narrative descriptions of the three developmental career stages from the original 1997 study, the research team renamed beginning to novice directors and competent to capable directors. Results showed that 1,290 administrators self-identified their leadership competence level with the following results: novice – 69 (5%); capable – 859 (67%); and master – 362 (28%). Percentages among developmental stages differed somewhat from the original study: novice – 30%; capable – 60%; master – 10%. It is worth noting that approximately 20% of respondents had participated in a leadership academy prior to completing the survey and the percentage of directors with a baccalaureate degree or higher (79%) exceeds the national norm (62%). Both of these factors are likely to contribute to these results.
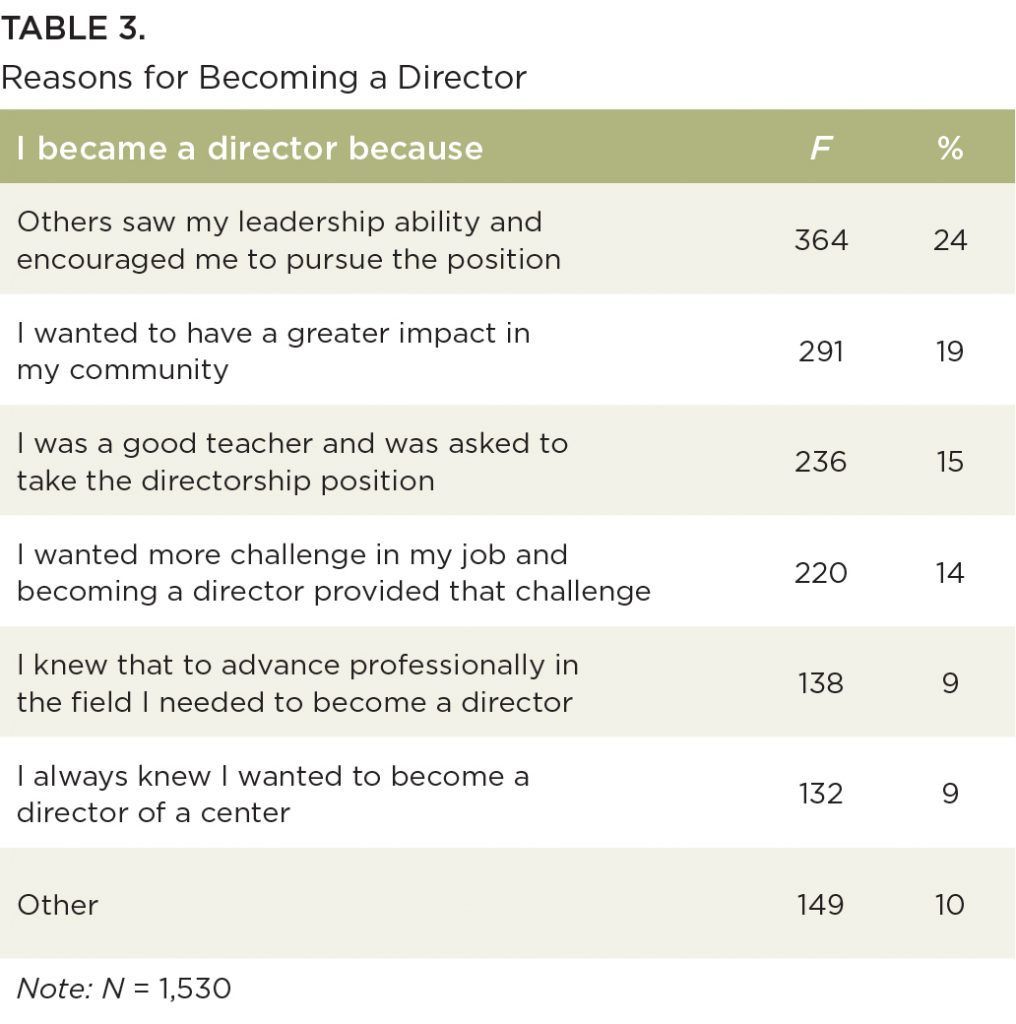
Respondents also reported on their reasons for becoming a director. The most frequently cited reason was that others saw the person’s leadership ability and encouraged them to pursue the director position (24%). Many individuals were encouraged to pursue leadership because they were good teachers in the past and were asked to take the director position (15%). Combining these two responses, 39% of the sample were externally motivated to become a director. Responses in the “other” category included reasons such as “opportunity to own a business,” “fell into my lap,” and “appointed when director left.” Table 3 lists the frequency and percentages of reasons individuals became directors.
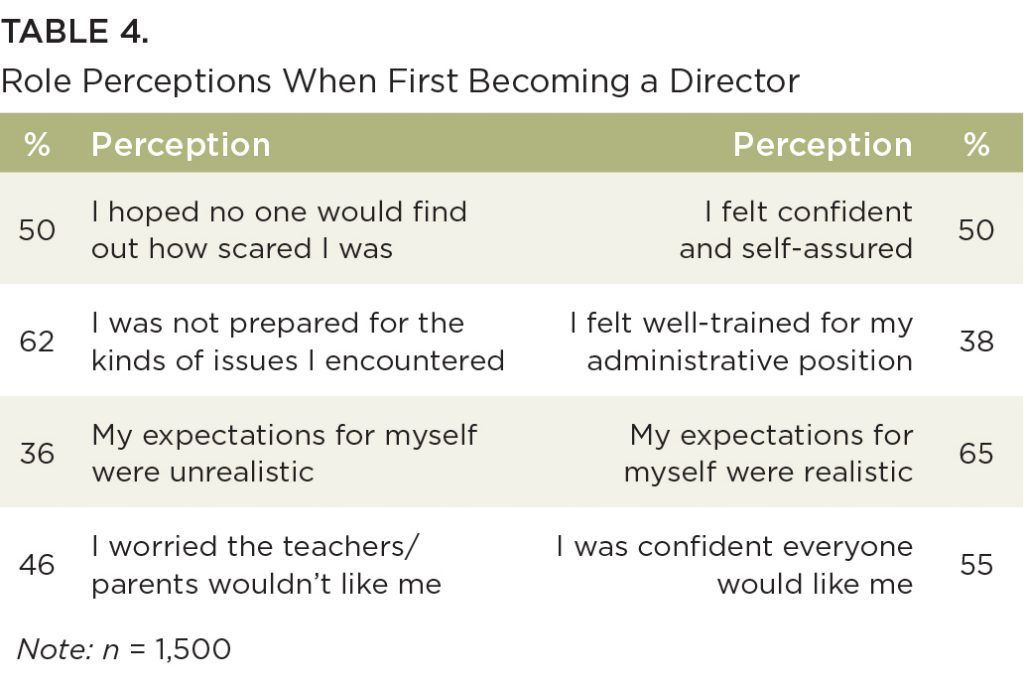
Participants were asked to respond to pairs of dichotomous questions about their role perceptions when they first assumed an administrative position. The results of their choices are shown in Table 4.
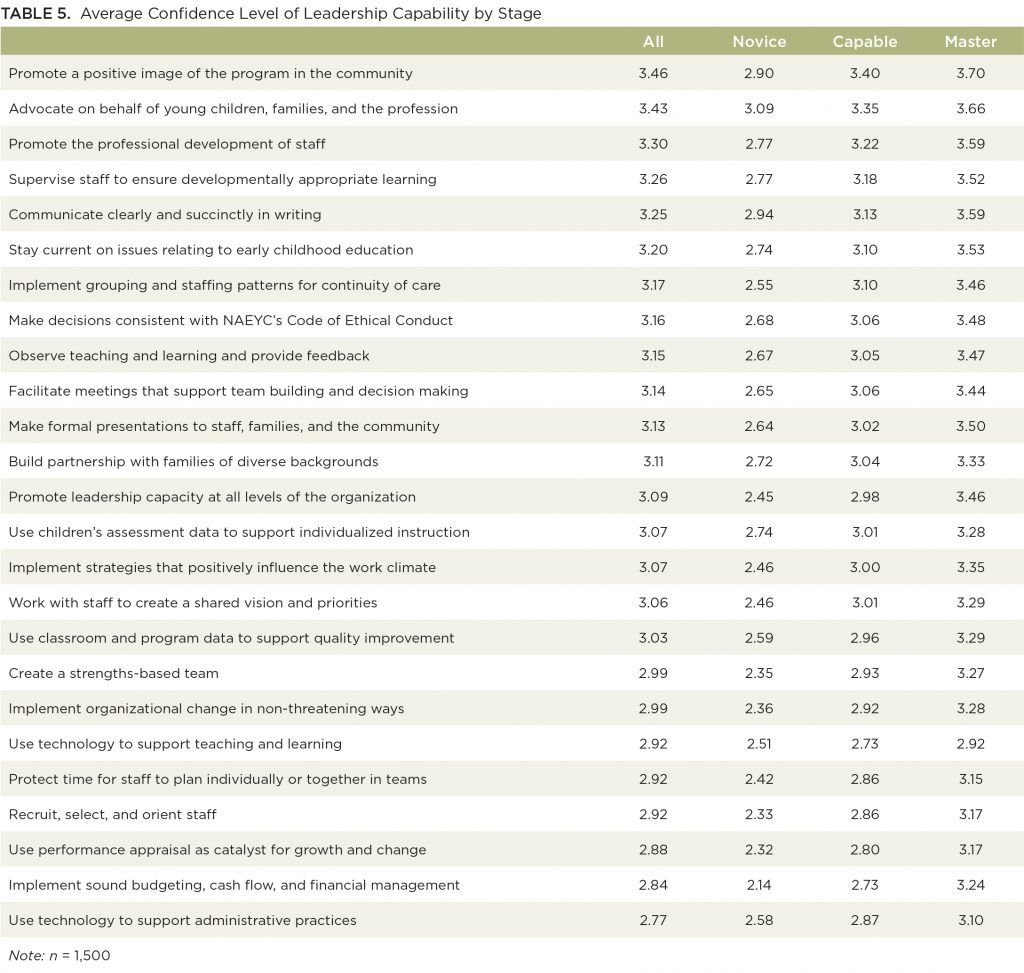
Respondents ranked their current level of confidence in several areas related to their leadership capability. Each question was scored on a range from 1 = “I am not confident in my ability” to 4 = “I am very confident in my ability.” The average scores for all respondents as well as the average scores for each of the developmental stage groups were computed. Individuals who saw themselves in a higher stage of development were more likely to be confident in their perceived leadership competence. Results indicate that there was a statistically significant difference between perceived self-efficacy depending on the director’s development stage: F(2,1289) = 122.27, p = <.001. However, the corresponding effect size was small. Overall, self-efficacy had an effect size of η2 = .169; suggesting that about 17% of the variance in self-efficacy scores could be attributed to the developmental stage of directors. Table 5 shows the average scores in directors’ confidence about their leadership capability for all respondents as well as those of each of the developmental stage groups.
Participants were asked to select three words or phrases that best described their role as director. The top three choices based on frequency are listed in Table 6 within each developmental stage.
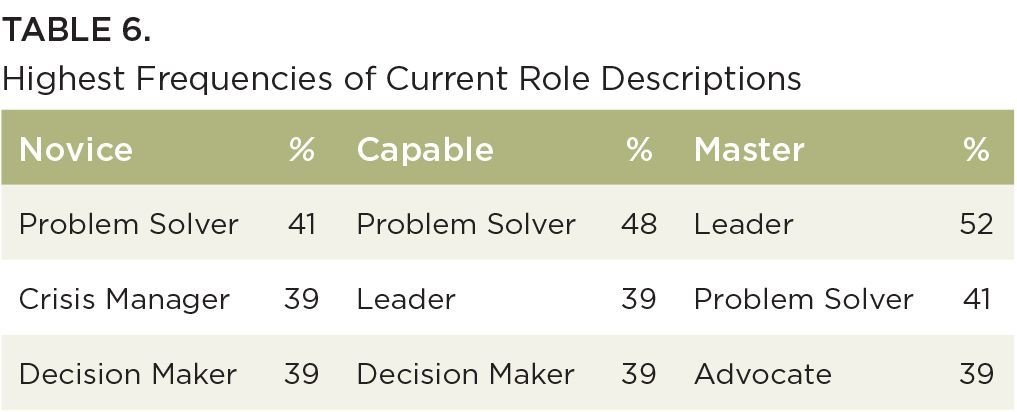
There is overlap among the selection of words or phrases among the developmental stages. Problem solver is represented in each stage. In addition, consecutive stages share two similar words or phrases.
Participants were asked to select three words or phrases that describe their current job. The top choices based on frequency are listed in Table 7 within each developmental stage.
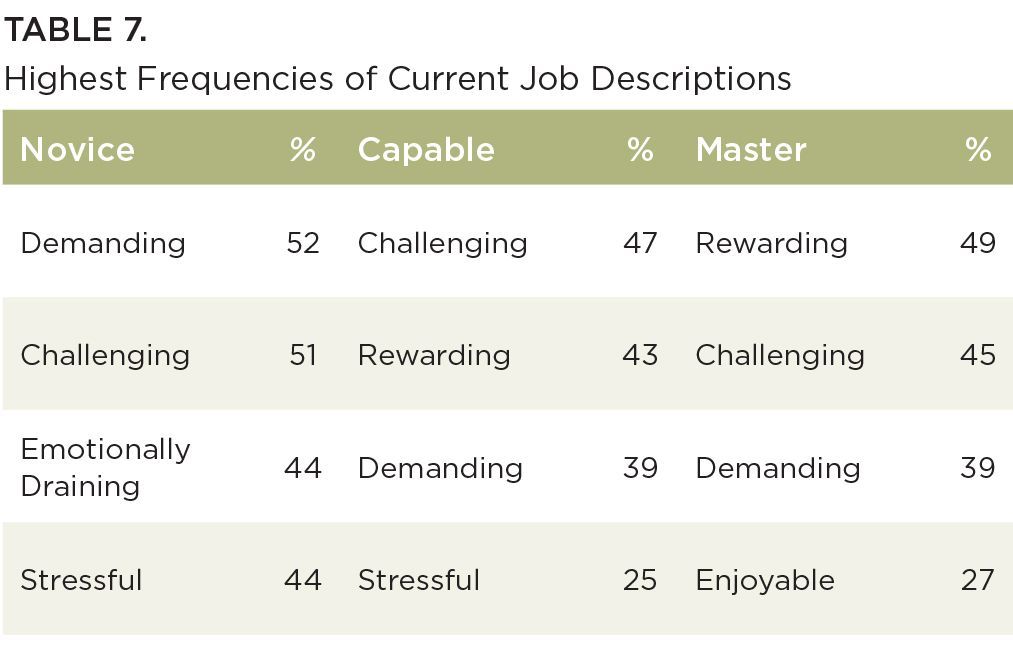
There is overlap among the selection of words or phrases among the developmental stages. Challenging and demanding are represented in each stage. In addition, consecutive stages share similar words or phrases.
DISCUSSION
Findings from this study provide insight into directors’ backgrounds and their perceptions about their roles. Forty-two percent of the respondents had previous experience as a teacher. Some indicated they were recognized as good teachers and asked to become directors. Others were encouraged to pursue the directorship due to their demonstrated leadership ability. However, upon becoming a director, only half of the respondents were confident in their role and more than 60% felt unprepared for the position.
Two-thirds (67%) of respondents identified themselves as capable directors and 28% perceived themselves as master directors. However, the percentage of novice directors was substantially lower (5%). One explanation for this difference could be that the characteristics of the sample (mean of 23 years in early childhood education; mean of 13 years in an administrative position, 19% attended a leadership academy, 79% achieved a minimum of a baccalaureate degree) may have skewed the results. Additional research is needed to further explore the distribution of directors in developmental stages.
Differences were found in the confidence levels regarding leadership capability among novice, capable, and master directors. While the confidence levels increased along the developmental levels for all the items, they did not increase at the same magnitude. For example, budgeting and financial management was the lowest rated item for novice directors, but was not ranked as low for master directors. Promoting leadership at all levels within the organization was rated relatively low for capable directors and relatively high for master directors. While the use of technology to support administrative practices was the lowest ranked item for master directors, it was not a low-ranked item for novice directors.
Perceptions of the role of director and perceptions of their current job included some overlap among development stage. There is also evidence of a progression of perceptions. For example words often associated with more difficulty such as “crisis manager,” “emotionally draining” and “stressful” are used among those identified as novice and capable directors whereas words often associated with less difficulty and more satisfaction such as “leader,” “rewarding,” and “enjoyable” are used among those identified as capable and master directors.
Taken as a whole, these findings suggest the professional development needs for directors differ by career stage. Additional research would be useful to better understand the unique leadership development needs of directors and how to design professional development based on these stages. These findings may be particularly useful for policy-makers, systems developers, and technical assistance providers in tailoring professional learning for optimal leadership development.
REFERENCES
Abel, M., Talan, T., & Masterson, M. (2017, January/February). Whole leadership: A framework for early childhood programs. Exchange Magazine, January/February, 39(1), 22-25.
Bella, J., Abel, M., Bloom, P.J., and Talan, T. (2017). Directors’ Role Perception Survey. Wheeling, IL: McCormick Center for Early Childhood Leadership.
Billman, J. (1995). Child care program directors: What skills do they need? Results of a statewide survey. Early Childhood Education Journal, 23(2), 63-70.
Bloom, P., & Rafanello, D. (1994, June). The professional development of early childhood center directors: key elements of effective training models. Paper presented at the National Association of Early Childhood Teacher Educators, Chicago, IL.
Catron, C., & Groves, M. (1999). Teacher to director: A developmental journey. Early Childhood Education Journal, 26(3), 183-188.
Herzenberg, S., Price, M. & Bradley, D. (2005). Losing ground in early childhood education: Declining workforce qualifications in an expanding industry, 1979-2004. Harrisburg, PA: Keystone Research Center.
Rafanello, D. & Bloom, P. (1997, August). The 1997 Illinois Directors’ Study. A Report to the Robert R. McCormick Foundation, Chicago, IL.


