How Attitudes about Work Differ Across Program Types and Staff Roles

A woman wearing glasses and a suit is smiling in front of a flag.

Sim Loh is a family partnership coordinator at Children’s Village, a nationally-accredited Keystone 4 STARS early learning and school-age enrichment program in Philadelphia, Pennsylvania, serving about 350 children. She supports children and families, including non-English speaking families of immigrant status, by ensuring equitable access to education, health, employment, and legal information and resources on a day-to-day basis. She is a member of the Children First Racial Equity Early Childhood Education Provider Council, a community member representative of Philadelphia School District Multilingual Advisory Council, and a board member of Historic Philadelphia.


Sim explains, “I ensure families know their rights and educate them on ways to speak up for themselves and request for interpretation/translation services. I share families’ stories and experiences with legislators and decision-makers so that their needs are understood. Attending Leadership Connections will help me strengthen and grow my skills in all domains by interacting with and hearing from experienced leaders in different positions. With newly acquired skills, I seek to learn about the systems level while paying close attention to the accessibility and barriers of different systems and resources and their impacts on young children and their families.”

This document may be printed, photocopied, and disseminated freely with attribution. All content is the property of the McCormick Center for Early Childhood Leadership.

This resource is part of our Research Notes series. 


The attitudes of those who work in human service fields are critical to the outcomes of the people they serve. Research suggests that factors such as overwork, poor interpersonal relationships with colleagues, dissatisfaction with pay, lack of employee involvement in decision making, and low levels of support from management contribute to negative workplace attitudes and lead to high turnover (Leider, Harper, Shon, Sellers, and Castrucci, 2016; Reynolds, 2007). In early childhood education, relationships between teachers and children are affected when teachers experience workplace stress (Cassidy, King, Wang, Lower, & Kintner-Duffy, 2016; Whitaker, Dearth- Wesley, and Gooze, 2014; Zinsser and Curby, 2014). The Center for the Study of Child Care Employment found that insufficient teaching supports and inadequate compensation lead to poor program quality and high turnover (Whitebook, King, Philipp, and Sakai, 2016).


To better understand the conditions that affect attitudes about the workplace, the McCormick Center for Early Childhood Leadership at National Louis University examined data from child care center staff and administrators who completed the Early Childhood Work Environment Survey (ECWES) (Bloom, 2016). While attitudes about the early childhood workplace were mostly positive, negative work attitudes differed by the employee’s role, program type, and program size.


SAMPLE AND METHODOLOGY


An existing dataset of 2,652 child care center staff and administrators, who completed the ECWES online survey between August 2015 and March 2017, was examined. Participants represented 197 programs from 15 states or Canadian provinces. Their highest level of education was well distributed: 20% high school or GED, 32% some college, 18% associate degree, 20% baccalaureate degree, 3% some graduate studies, 6% graduate degree, and 1% post-graduate studies or doctoral degree. On average, participants worked in the field of early childhood education for 11 years; were with their current employer for five years; and served in their current position for four years. At the time of completing the survey, participants worked in a number of roles as indicated in Table 1.

A table showing the frequency of administrative roles

There was also a distribution of program types where the participants were employed. Figure 1 shows the various types of programs represented in the sample.

A graph showing the percentages of different program types

Eighty percent of the programs served infants, 93% served toddlers, 97% served preschoolers, and 61% of the programs served school-aged children. The average enrollment was 115 (SD = 89) and the average licensed capacity was 146 (SD = 124).


The ECWES is a reliable and valid instrument that measures multiple aspects of the workplace environment including work attitudes, ideal perceptions and expectations about the workplace, and ten dimensions of organizational climate. One domain—work attitudes—was selected for this analysis. It assesses perceptions about the organization by selecting from ten descriptors (five positive and five negative) of how the employee feels about the organization. Frequencies were compared to characteristics of the participants and their programs using one-way ANOVA to determine whether factors could predict work attitudes.


FINDINGS


Analysis of the survey responses revealed that overall, child care employees were more positive than negative in their attitudes about their workplace. Nearly two-thirds of the respondents put extra effort into their work, took pride in their center, and were very committed to working there. About half of the respondents plan to work at their current place of employment for the next two years or more. However, only 25% of the respondents felt it would be difficult to find a job as good as the one where they were currently working. Additionally, about 15% of the respondents often thought of quitting. Less than 10% of child care employees felt trapped in their jobs, struggled with being committed to their center, felt they were just putting in time, or would not care about the center if they left. Table 2 shows the frequency and percent of responses about work attitudes.

A table showing the number and percent of work attitude responses

Responses were analyzed to determine if there were differences in work attitudes by the characteristics of respondents or by the characteristics of the child care centers where they worked. No differences in attitudes about work were found based on gender or highest level of education. Differences were found for respondents based on their roles, by program type, or by program enrollment.


There was a statistically significant difference between respondents based on their role as determined by one-way ANOVA, F (10, 2641) = 3.052, p = .001, η2 = .011. A Tukey post hoc test revealed that work attitudes among directors and assistant directors were more positive than staff in other roles. However, the magnitude of these differences was small.


Significant differences were also found, using one-way ANOVA, among the types of programs where respondents worked F (10, 2641) = 2.603, p = .004, η2 = .001. The effect size of these differences is very small and should be considered when understanding the magnitude of this finding. Table 3 shows the means and standard deviations for the different types of programs. Mean scores are computed by averaging the number of Work Attitude Responses, ranging from -5.0 (five negative work attitudes selected) to 5.0 (five positive work attitudes selected).

A table showing work attitudes by program type

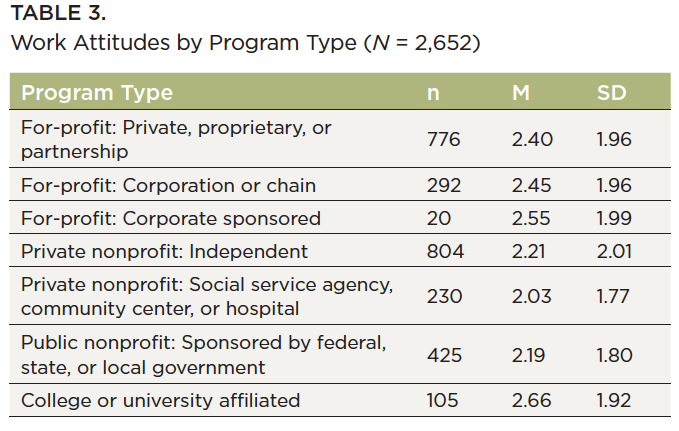
A statistically significant difference was also found between groups based on the size of program enrollment when a one-way ANOVA was performed, F (2, 2645) = 20.37, p = .000, η2 = .015. Program size was grouped as small (1-69), medium (70-139), and large (140+). A Tukey post hoc test revealed that work attitudes among staff in large programs (m=1.90, sd= 1.95) were rated lower than those of small (m=2.52, sd= 1.85) and medium (m=2.39, sd= 1.94) sized programs.


DISCUSSION


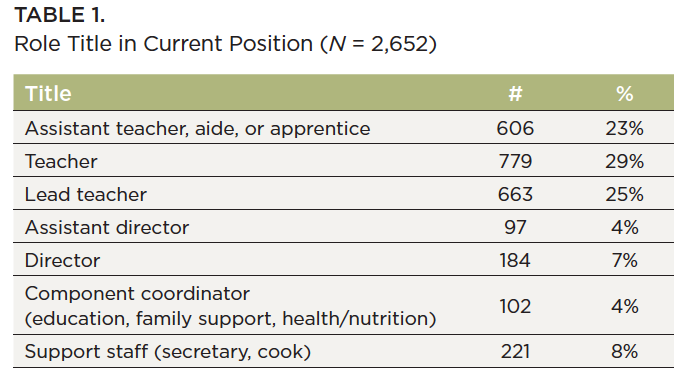
Findings from this study suggest that a majority of child care center staff have positive work attitudes and plan to continue working at their current place of employment. However, there is a small portion of employees who have serious negative attitudes including feeling trapped in their jobs, lack of commitment to the center, or are “just putting in their time.” The finding that 15% of child care workers frequently think about quitting their jobs is consistent with high turnover in early childhood education. Early childhood program leaders should work to identify negative attitudes in the workplace, because of their effects on the quality of care and education, including interactions with children.


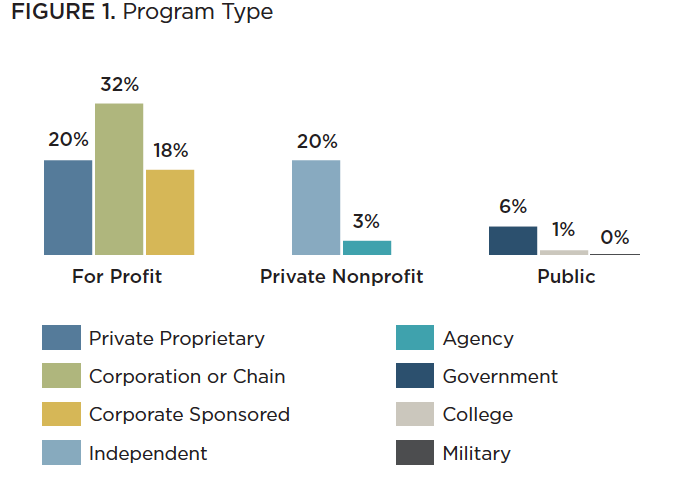
Differences in work attitudes between administrators and staff serving in other roles suggest a need for examination of attitudes among teaching and support staff. Less positive work attitudes among staff in the non-profit sector indicate that additional research is needed to understand what specific factors contribute to this disparity. Furthermore, this study identifies the potential challenge of maintaining positive work attitudes in larger centers. However, the small magnitude of effects in these group comparisons indicate that further study is advised to confirm group differences.


REFERENCES


Bloom, P. J. (2016). Measuring work attitudes in early childhood settings: Technical manual for the Early Childhood Job Satisfaction Survey (ECJSS) and the Early Childhood Work Environment Survey (ECWES) (3rd ed.). Lake Forest, IL: New Horizons.


Cassidy, D. J., King, E. K., Wang, Y. C, Lower, J. K., & Kintner- Duffy, V. L. (2016): Teacher work environments are toddler learning environments: teacher professional well-being, classroom emotional support, and toddlers’ emotional expressions and behaviours. Early Child Development and Care. DOI: 10.1080/03004430.2016.1180516


Leider, J. P., Harper, E., Shon, J. W., Sellers, K., & Castrucci, B. C. (2016). Job satisfaction and expected turnover among federal, state, and local public health practitioners. American Journal Of Public Health, 106(10), 1782-1788. doi:10.2105/ AJPH.2016.303305


Park, M. R., & Myeong-Gu, S. (2017). The role of affect climate in organizational effectiveness. Academy Of Management Review, 42(2), 334-360. doi:10.5465/amr.2014.0424


Reynolds, J. J. (2007). Negativity in the workplace. American Journal of Nursing, 107(3), 72D.


Whitaker, R. C., Dearth-Wesley, T., Gooze, R. A. (2014). Workplace stress and the quality of teacher-children relationships in Head Start. Early Childhood Research Quarterly 30(2015), 57-69.


Whitebook, M., King, E., Philipp, G., & Sakai, L. (2016). Teachers’ Voices: Work Environment Conditions That Impact Teacher Practice and Program Quality. Berkeley, CA: Center for the Study of Child Care Employment, University of California, Berkeley.


Woestman, D. S., & Wasonga, T. A. (2015). Destructive leadership behaviors and workplace attitudes in schools. NASSP Bulletin, 99(2), 147-163.


Üstün, A. (2017). Effects of the leadership roles of administrators who work at special education schools upon organizational climate. Universal Journal of Educational Research, 5(3), 504- 509.


Zinsser, K. M., & Curby, T. W. (2014). Understanding preschool teachers’ emotional support as a function of center climate. Sage. DOI: 10.1177/2158244014560728.

By Robyn Kelton, M.A. June 27, 2025
INTRODUCTION Turnover rates in child care are among the highest in education, with over 160,000 workforce openings predicted annually (Bassok et al., 2014; Doromal et al., 2022; Joughin, 2021; U.S. Bureau of Labor Statistics, 2025). While some turnover is expected and even necessary, the levels of turnover experienced in the field of early childhood education and care (ECEC) are not only alarmingly high but deeply problematic. In 2021, a national survey conducted by the National Association for the Education of Young Children found that over 80% of child care centers were experiencing a staffing shortage, with the majority of those programs reporting one-to-five open roles, but 15% reporting between six and 15 open roles (NAEYC, 2021). Staffing shortages result in lost revenue, financial uncertainty, and program instability, often forcing administrators to operate below capacity and/or under reduced hours (NAEYC, 2021; NAEYC, 2024; Zero to Three, 2024). Limited enrollment slots and classroom and program closures lead to increased waiting lists (Zero to Three, 2024; Carrazana, 2023). In turn, families are placed in a highly vulnerable position of needing to leave the workforce to stay home with their child or turn to potentially unsafe or unregulated child care. Moreover, increased turnover in classrooms interrupts continuity of care and disrupts the relationships built between children and their educators (Reidt-Parker, J., & Chainski, M. J. (2015). Research has begun to highlight some of the programmatic and personnel characteristics predictive of increased staff turnover in ECEC programs. Low wages are most commonly identified as a strong predictor of turnover (Amadon et al., 2023; Bryant et al., 2023; Fee, 2024; Guevara, 2022; Totenhagen et al., 2016). However, workforce advocates and some researchers have begun to expand conversations on compensation to explore the impact the profession’s general lack of benefits such as paid time off, access to health insurance, and retirement benefits has on retention (e.g., Amadon et al., 2023; Bryant et al., 2023; Fee, 2024; Lucas, 2023). While informative, this body of work has typically approached benefits as binary variables (i.e., have or do not have) rather than reflect the spectrum on which benefits are commonly offered (e.g., the number of days off, the percent of insurance covered by the employer, and levels of retirement matching funds). This Research Note aims to expand on previous work investigating the relationship between benefits and turnover by exploring the possibility of a more nuanced relationship between the variables to determine if the level of benefits offered impacts turnover rates. METHOD This study used data collected via formal Program Administration Scale, 3rd Edition (PAS-3) assessments conducted by Certified PAS-3 Assessors between 2023 and 2025. To become certified, PAS-3 assessors must first achieve reliability (a score of at least 86%) on a test conducted after four days of training on the tool. Next, they must conduct two PAS assessments within three months of reliability training. PAS-3 national anchors reviewed the completed assessments for consistency, accuracy, and completeness. The study analyzed data from 133 PAS-3 assessments collected during the certification process across 12 states, the District of Columbia, and the U.S. Mariana Islands.  Measures Data for this study were collected using the PAS-3, a valid and reliable tool used to measure and improve Whole Leadership practices in center-based programs (Talan, Bella, Jorde Bloom, 2022). The PAS-3 includes 25 items, each composed of 2-5 indicator strands and scored on a 7-point Likert scale (1 = inadequate, 3 = minimal, 5 = good, and 7 = excellent). Item scores are averaged to determine a mean PAS-3 score. Of particular interest to this study is Item 5: Benefits. Item 5 measures employee access to health insurance and considers what percentage of the cost is paid by the employer, the total number of paid time off days within the first and fifth years of employment, access to a retirement plan, and the percentage at which the employer will match the employee’s contribution. Last, Item 5 explores provisions made to cover the costs of staff’s professional development. Non-applicable is allowed as a response for indicators related to health insurance and retirement if there are no full-time staff employed by the program. Sample Program enrollment ranged in size from four children to 285, with a mean enrollment of 65 and a median of 55. Total program staff for the sample ranged from two to 44 staff, with an average of just under 14 staff (13.93) and a standard deviation of 8.80. Table 1 below provides a detailed breakdown of staff by role and full-time and part-time status.
Show More