Child Care Center Directors’ Experiences with QRIS

A woman wearing glasses and a suit is smiling in front of a flag.

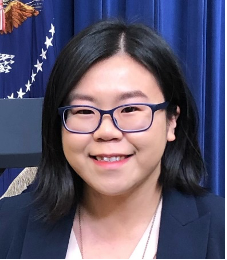
Sim Loh is a family partnership coordinator at Children’s Village, a nationally-accredited Keystone 4 STARS early learning and school-age enrichment program in Philadelphia, Pennsylvania, serving about 350 children. She supports children and families, including non-English speaking families of immigrant status, by ensuring equitable access to education, health, employment, and legal information and resources on a day-to-day basis. She is a member of the Children First Racial Equity Early Childhood Education Provider Council, a community member representative of Philadelphia School District Multilingual Advisory Council, and a board member of Historic Philadelphia.


Sim explains, “I ensure families know their rights and educate them on ways to speak up for themselves and request for interpretation/translation services. I share families’ stories and experiences with legislators and decision-makers so that their needs are understood. Attending Leadership Connections will help me strengthen and grow my skills in all domains by interacting with and hearing from experienced leaders in different positions. With newly acquired skills, I seek to learn about the systems level while paying close attention to the accessibility and barriers of different systems and resources and their impacts on young children and their families.”

Implementing a quality rating and improvement system (QRIS) is an increasingly popular strategy to expand the access of families, especially the most vulnerable, to high-quality child care programs. Currently there are 22 statewide QRIS and several states have QRIS implemented at the county level. Recently QRIS was a major component of the Race-to-the-Top Early Learning Challenge competition. It is likely to continue to be the framework on which policymakers build an integrated system of early learning and development, inclusive of child care, Head Start, and state-funded pre-K programs. The National Women’s Law Center (NWLC) and the Center for Law and Social Policy (CLASP), recently conducted a study to explore the perspective of center directors on both the opportunities and the challenges faced by “on-the-ground” participants in QRIS. … Download this resource to read the rest of the research.


This resource is part of our Research Note series.

By Robyn Kelton, M.A. June 27, 2025
INTRODUCTION Turnover rates in child care are among the highest in education, with over 160,000 workforce openings predicted annually (Bassok et al., 2014; Doromal et al., 2022; Joughin, 2021; U.S. Bureau of Labor Statistics, 2025). While some turnover is expected and even necessary, the levels of turnover experienced in the field of early childhood education and care (ECEC) are not only alarmingly high but deeply problematic. In 2021, a national survey conducted by the National Association for the Education of Young Children found that over 80% of child care centers were experiencing a staffing shortage, with the majority of those programs reporting one-to-five open roles, but 15% reporting between six and 15 open roles (NAEYC, 2021). Staffing shortages result in lost revenue, financial uncertainty, and program instability, often forcing administrators to operate below capacity and/or under reduced hours (NAEYC, 2021; NAEYC, 2024; Zero to Three, 2024). Limited enrollment slots and classroom and program closures lead to increased waiting lists (Zero to Three, 2024; Carrazana, 2023). In turn, families are placed in a highly vulnerable position of needing to leave the workforce to stay home with their child or turn to potentially unsafe or unregulated child care. Moreover, increased turnover in classrooms interrupts continuity of care and disrupts the relationships built between children and their educators (Reidt-Parker, J., & Chainski, M. J. (2015). Research has begun to highlight some of the programmatic and personnel characteristics predictive of increased staff turnover in ECEC programs. Low wages are most commonly identified as a strong predictor of turnover (Amadon et al., 2023; Bryant et al., 2023; Fee, 2024; Guevara, 2022; Totenhagen et al., 2016). However, workforce advocates and some researchers have begun to expand conversations on compensation to explore the impact the profession’s general lack of benefits such as paid time off, access to health insurance, and retirement benefits has on retention (e.g., Amadon et al., 2023; Bryant et al., 2023; Fee, 2024; Lucas, 2023). While informative, this body of work has typically approached benefits as binary variables (i.e., have or do not have) rather than reflect the spectrum on which benefits are commonly offered (e.g., the number of days off, the percent of insurance covered by the employer, and levels of retirement matching funds). This Research Note aims to expand on previous work investigating the relationship between benefits and turnover by exploring the possibility of a more nuanced relationship between the variables to determine if the level of benefits offered impacts turnover rates. METHOD This study used data collected via formal Program Administration Scale, 3rd Edition (PAS-3) assessments conducted by Certified PAS-3 Assessors between 2023 and 2025. To become certified, PAS-3 assessors must first achieve reliability (a score of at least 86%) on a test conducted after four days of training on the tool. Next, they must conduct two PAS assessments within three months of reliability training. PAS-3 national anchors reviewed the completed assessments for consistency, accuracy, and completeness. The study analyzed data from 133 PAS-3 assessments collected during the certification process across 12 states, the District of Columbia, and the U.S. Mariana Islands.  Measures Data for this study were collected using the PAS-3, a valid and reliable tool used to measure and improve Whole Leadership practices in center-based programs (Talan, Bella, Jorde Bloom, 2022). The PAS-3 includes 25 items, each composed of 2-5 indicator strands and scored on a 7-point Likert scale (1 = inadequate, 3 = minimal, 5 = good, and 7 = excellent). Item scores are averaged to determine a mean PAS-3 score. Of particular interest to this study is Item 5: Benefits. Item 5 measures employee access to health insurance and considers what percentage of the cost is paid by the employer, the total number of paid time off days within the first and fifth years of employment, access to a retirement plan, and the percentage at which the employer will match the employee’s contribution. Last, Item 5 explores provisions made to cover the costs of staff’s professional development. Non-applicable is allowed as a response for indicators related to health insurance and retirement if there are no full-time staff employed by the program. Sample Program enrollment ranged in size from four children to 285, with a mean enrollment of 65 and a median of 55. Total program staff for the sample ranged from two to 44 staff, with an average of just under 14 staff (13.93) and a standard deviation of 8.80. Table 1 below provides a detailed breakdown of staff by role and full-time and part-time status.
Show More