Paula Jorde Bloom Scholarship Broadens Horizons

Photo from Sim Loh’s LinkedIn, with permission

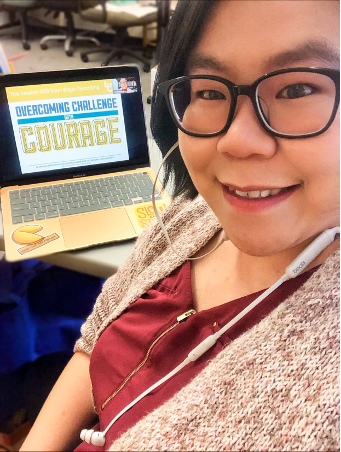
During a recent conversation, Sim Loh, a 2022 Paua Jorde Bloom (PJB) Scholarship recipient, shared how attending the 2022 Leadership Connections National Conference had a significant and lasting impact and broadened her ECE perspective. As a scholarship winner, Loh received registration to the three-day National Leadership Connections conference and a full day of pre-conference workshops at no cost! As she captured in this selfie, Loh was able to break from her daily duties as the Family Partnership Coordinator at Children’s Village in Philadelphia, PA, to attend the virtual conference.


The PJB Scholarship, first awarded in 2019, is intended to support emerging and aspiring early childhood leaders dedicated to providing the highest quality care and education for children and families. The scholarship, established by Paula’s family after she passed in 2018, highlights her legendary devotion to improving early childhood professional standards.


An award like the PJB scholarship, a selective honor valued at $500 and given to two emerging or aspiring early childhood leaders annually, actually reads more like a footnote on Loh’s resume. In addition to her role at Children’s Village, she is a member of the Children First PA Racial Equity Early Childhood Education Provider Council, a community member representative of the Philadelphia School District Multilingual Advisory Council, and a Board Member of Historic Philadelphia. As Family Partnership Coordinator at Children’s Village, she supports the communities served by her center, including non-English speaking immigrant families, and empowers them to advocate for themselves. “I don’t want to speak for the families, I would rather they speak for themselves,” she said.


Outside of her comprehensive work in the state of Pennsylvania, Loh finds few opportunities to meet other professionals and advocates from around the country and the world, which is why attending this national conference had such an impact.


Loh shared that the networking sessions set Leadership Connections apart from other virtual conferences. “It’s a rare opportunity to meet people from different states. I know how things work in Philadelphia, but not necessarily how things work in other states outside of Pennsylvania,” she said. “So being able to have those conversations, being able to meet people from different states helps me to see the system from a different perspective.”


“Leadership Connections helps everyone to recognize the leader in themselves, a leader who can overcome challenges and make changes they want to see happen.”


The McCormick Center’s “The Time is Now: Leadership and Advocacy” Leadership Connections conference will take place virtually from April 26-28, 2023, with a virtual pre-conference on April 25, 2023. The conference offers opportunities to attend a wide range of sessions relevant to your work as an early childhood leader, network with professionals who relate to your trials and triumphs, and find inspiration from influential specialists in our field.


For Leadership Connections 2023, we are pleased to announce that two scholarships will be awarded to emerging and aspiring leaders. Scholarship applications will be accepted through January 6, 2023.


Click here for complete details and to apply for the 2023 Paula Jorde Bloom Scholarship.


Click here for complete details and to register for the 2023 Leadership Connections National Virtual Conference.

By Robyn Kelton, M.A. June 27, 2025
INTRODUCTION Turnover rates in child care are among the highest in education, with over 160,000 workforce openings predicted annually (Bassok et al., 2014; Doromal et al., 2022; Joughin, 2021; U.S. Bureau of Labor Statistics, 2025). While some turnover is expected and even necessary, the levels of turnover experienced in the field of early childhood education and care (ECEC) are not only alarmingly high but deeply problematic. In 2021, a national survey conducted by the National Association for the Education of Young Children found that over 80% of child care centers were experiencing a staffing shortage, with the majority of those programs reporting one-to-five open roles, but 15% reporting between six and 15 open roles (NAEYC, 2021). Staffing shortages result in lost revenue, financial uncertainty, and program instability, often forcing administrators to operate below capacity and/or under reduced hours (NAEYC, 2021; NAEYC, 2024; Zero to Three, 2024). Limited enrollment slots and classroom and program closures lead to increased waiting lists (Zero to Three, 2024; Carrazana, 2023). In turn, families are placed in a highly vulnerable position of needing to leave the workforce to stay home with their child or turn to potentially unsafe or unregulated child care. Moreover, increased turnover in classrooms interrupts continuity of care and disrupts the relationships built between children and their educators (Reidt-Parker, J., & Chainski, M. J. (2015). Research has begun to highlight some of the programmatic and personnel characteristics predictive of increased staff turnover in ECEC programs. Low wages are most commonly identified as a strong predictor of turnover (Amadon et al., 2023; Bryant et al., 2023; Fee, 2024; Guevara, 2022; Totenhagen et al., 2016). However, workforce advocates and some researchers have begun to expand conversations on compensation to explore the impact the profession’s general lack of benefits such as paid time off, access to health insurance, and retirement benefits has on retention (e.g., Amadon et al., 2023; Bryant et al., 2023; Fee, 2024; Lucas, 2023). While informative, this body of work has typically approached benefits as binary variables (i.e., have or do not have) rather than reflect the spectrum on which benefits are commonly offered (e.g., the number of days off, the percent of insurance covered by the employer, and levels of retirement matching funds). This Research Note aims to expand on previous work investigating the relationship between benefits and turnover by exploring the possibility of a more nuanced relationship between the variables to determine if the level of benefits offered impacts turnover rates. METHOD This study used data collected via formal Program Administration Scale, 3rd Edition (PAS-3) assessments conducted by Certified PAS-3 Assessors between 2023 and 2025. To become certified, PAS-3 assessors must first achieve reliability (a score of at least 86%) on a test conducted after four days of training on the tool. Next, they must conduct two PAS assessments within three months of reliability training. PAS-3 national anchors reviewed the completed assessments for consistency, accuracy, and completeness. The study analyzed data from 133 PAS-3 assessments collected during the certification process across 12 states, the District of Columbia, and the U.S. Mariana Islands.  Measures Data for this study were collected using the PAS-3, a valid and reliable tool used to measure and improve Whole Leadership practices in center-based programs (Talan, Bella, Jorde Bloom, 2022). The PAS-3 includes 25 items, each composed of 2-5 indicator strands and scored on a 7-point Likert scale (1 = inadequate, 3 = minimal, 5 = good, and 7 = excellent). Item scores are averaged to determine a mean PAS-3 score. Of particular interest to this study is Item 5: Benefits. Item 5 measures employee access to health insurance and considers what percentage of the cost is paid by the employer, the total number of paid time off days within the first and fifth years of employment, access to a retirement plan, and the percentage at which the employer will match the employee’s contribution. Last, Item 5 explores provisions made to cover the costs of staff’s professional development. Non-applicable is allowed as a response for indicators related to health insurance and retirement if there are no full-time staff employed by the program. Sample Program enrollment ranged in size from four children to 285, with a mean enrollment of 65 and a median of 55. Total program staff for the sample ranged from two to 44 staff, with an average of just under 14 staff (13.93) and a standard deviation of 8.80. Table 1 below provides a detailed breakdown of staff by role and full-time and part-time status.
Show More