Small Business, Big Implications: A Look at Business Practices in Family Child Care Programs
BY Robyn Kelton and Irina Tenis | January 31, 2024
This document may be printed, photocopied, and disseminated freely with attribution. All content is the property of the McCormick Center for Early Childhood Leadership.
Family child care (FCC) programs in which listed or licensed child care professionals run early childhood education and care (ECEC) programs out of their homes meet the diverse economic, cultural, and logistical needs of families and communities across the country; yet FCC programs have been declining in number for nearly twenty years (National Center on Early Childhood Quality Assurance, 2020). One hypothesized factor contributing to the loss of FCC programs is deficits in critical business knowledge and practices (Bromer et al., 2021; National Center on Early Childhood Quality Assurance, 2020; Kelton, 2020; Vieria & Hill, 2019; Zeng et al., 2020). As Stoney and Blank (2021) note, “Without careful attention to the business side of the equation, a program risks not only an erosion in the quality of its services but, all too often, outright failure” (p. 4). However, little is known about the current level of business and professional practices in FCC programs. This article aims to help fill that literature gap by providing a window into the current status of business and professional practices in FCC programs and some of the potential implications of lagging small business practices.
THE DECLINE IN FCC
Research has demonstrated that families needing infant and toddler careor extended hours of care, families of color, and those living in rural areas are more likely to seek family child care than center-based care (Datta et al., 2021; Henly & Adams, 2018; National Center on Early Childhood Quality Assurance, 2020). However, the number of FCC programs has been declining for close to two decades. Pre-Covid pandemic data showed a 52% decline in licensed FCC programs between 2005 and 2017 with 22% of the decline occurring between 2014 and 2017 (National Center on Early Childhood Quality Assurance, 2020). The decrease seen between 2005 and 2017 was primarily due to the closure of 92,402 small FCC homes, and while there was a slight increase of 2,359 in large family child care homes, it is worth noting that the number of large FCC homes in 2005 was only 35,148 (National Center on Early Childhood Quality Assurance, 2020). The decline of FCC programs was mirrored by a decrease of 59% of FCC professionals receiving subsidy payments between 2005 and 2017 (National Center on Early Childhood Quality Assurance, 2020). More recent data demonstrated an 11% decline in licensed FCC programs from 2019 to 2022 (Child Care Aware of America, 2022).
THE IMPACT ON CHILDREN AND FAMILIES
It is no secret that the United States is experiencing a child care crisis. Despite the pandemic highlighting the essential role of child care in sustaining the American workforce and economy, the availability of child care slots continues to fall well below demand (Bishop, 2023; Coffey & Khatter, 2022; Flynn, 2023; Schochet, 2019). The extensive reduction in FCC programs adds to working families’ already insufficient access to high-quality child care. More specifically, the decline in FCC programs poses a significant threat to families of color, those needing care for infants and toddlers, and those working non-traditional hours (Bromer et al., 2021; National Center on Early Childhood Quality Assurance, 2020). Additionally, the loss of over half of the population of FCC providers receiving subsidy funds disproportionately threatens low-income families who are more likely to rely on FCC to meet their needs (Bromer et al., 2021; National Center on Early Childhood Quality Assurance, 2020; Vieria & Hill, 2019).
THE IMPACT ON THE ECONOMY
The United States child care crisis not only threatens the labor market by forcing working parents to stay home due to lack of child care, but also has a strong negative impact on the economy (Belfied, 2023; Bishop, 2023; Coffey & Khatter, 2022; 3Flynn, 2023). Bishop (2023) found that the economic costs of insufficient access to affordable, quality infant and toddler care led to an annual $78 billion in lost income for families, a $23 billion loss in productivity for employers, and a $21 billion loss in federal and state/local tax revenue. Even more alarming is that the total economic losses more than doubled between 2018 to 2022, and the number of infant and toddler parents who reported lack of child care caused them to be fired, have hours reduced, or pay decreased nearly tripled (Bishop, 2023).
THE IMPACT ON WOMEN’S CAREER AND BUSINESS PATHWAYS AND ECONOMIC INDEPENDENCE
It is highly likely that the decline in FCC disproportionally impacts women. When families cannot access affordable and high-quality child care, mothers are most likely to leave the workforce in order to stay home with their children (Schochet, 2019). Not only does the lack of child care prevent women from fully participating in the workforce to stay home with their children, but the ECEC field is dominated by women educators and entrepreneurs (Schochet, 2019). Women are estimated to own 90% of ECEC businesses, and more than half of those are owned by women of color (U.S. Senate Committee on Small Business and Entrepreneurship, 2023). Therefore, the decline in FCC programs implies a significant economic loss for women in general and women of color in particular.
INCREASED BUSINESS AND PROFESSIONAL COMPETENCIES AS A MECHANISM TO PREVENT DECLINE
While inferential research on the FCC workforce is scarce, recent work has hypothesized variables that may drive program closures. One domain of interest thought to impact FCC provider retention is business and professional practices. For example, in their literature review of quality in home-based child care, Bromer et al. (2021) highlighted conditions for operational sustainability as one of the four components of quality. The quality of working conditions and business practices and caregiver resources were identified as key subcomponents. While many providers may enter the field because of a passion for working with children, that passion is not always accompanied by the knowledge and skills needed to run a small business (Bromer et al., 2021). As the U.S. Senate Committee on Small Business and Entrepreneurship stated, child care businesses are “one of the most necessary, but difficult businesses to operate as operator pay is low and margins are tight” (2023, p. 9). To this point, numerous studies have highlighted the need to strengthen providers as small business owners (e.g,. Bromer et al., 2021; National Center on Early Childhood Quality Assurance, 2020; Vieria & Hill, 2019).
While the consensus grows regarding the importance of business and professional practices on the success and sustainability of FCC programs, little is known about the current quality of such practices. Without a clear sense of where FCC programs’ current practices are, it is difficult to determine what supports will best serve to grow and sustain this critical component of the ECEC workforce. This research aims to contribute to the literature focused on the success and sustainability of the FCC workforce by exploring the business and professional practices, as measured by the Business Administration Scale for Family Child Care (BAS), across a national sample of FCC programs.
STUDY METHODOLOGY
SAMPLE
Formal BAS assessments measuring business and professional practices were conducted in 210 family child care programs across 19 states and the Commonwealth of the Northern Mariana Islands between 2018 and 2023. Program demographic information was also collected using the Home Descriptive Information Form. Total enrollment across the sample of 210 FCC programs was 2,008 children. Program enrollment ranged from 1 to 24 (higher numbers of enrollment reflect programs that offered a combination of care options, including extended, evening, or overnight care or children who attended the program less than five days a week). Average enrollment was 9.61 children with a mode of 6. Forty-six percent (96) of the programs served infants, 84% (117) of the programs served toddlers, 90% (190) served preschoolers, and 63% (132) served school-age children. Eighteen percent (37) of programs had children enrolled in extended, evening, or overnight care, and 40% (84) had children who attended less than five days a week.
Seventy percent (147) of the programs served a total of 1,023 children who had some portion of their child care cost covered by state subsidy. Twenty-one percent (44) of programs served at least one child whose primary language was not English. Fifteen percent (32) of programs received Head Start or Early Head Start funding for a total of 173 children. Twelve percent (25) of the programs were accredited by the National Association for Family Child Care (NAFCC). Just over half (54%) of the family child care professionals in the sample were also employers. Forty-six percent (97) of programs employed at least one assistant, and twenty-six percent (56) employed at least one substitute (note that many programs employed both substitutes and assistants).
MEASURES
Data on business and professional practices were collected using the BAS,a valid and reliable tool used to measure the quality of business and professional practices in family child care programs. All indicators (statements of quality) are initially rated during an interview with the provider. After the interview, ratings are verified through a review of the program’s documentation. Following documentation verification, ratings are updated, and items are scored on a 7-point Likert scale with a score of 1 considered inadequate, 3 considered minimal, 5 considered good, and 7 considered excellent quality. If the provider is not an employer as defined in the BAS, item 10 (provider as employer) is nonapplicable. Item scores are averaged to determine a mean BAS score for the family child care program (Talan & Bloom, 2018). The BAS is moderately, yet significantly (r = .35, p < .05) correlated with quality as measured by the Family Child Care Environment Rating Scale (Kelton et al., 2014). The BAS includes ten items, each consisting of three to five indicator strands. All BAS assessments were conducted by Certified BAS Assessors who had received extensive training on the tool and achieved interrater reliability of 85% or above with the tool’s National Anchors.
FINDINGS
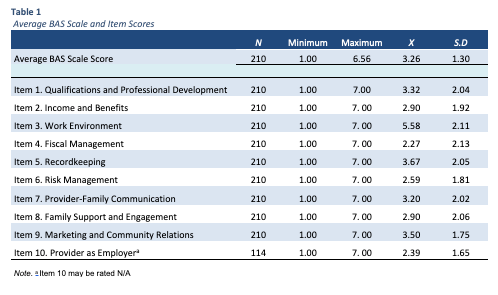
The average BAS score for the sample was 3.26 with a standard deviation of 1.30. Individual mean item scores ranged from 2.27 (Fiscal Management) to 5.58 (Work Environment). Table 1 provides the means, standard deviations, and ranges for all individual item scores as well as the overall score. As noted in the table, item averages fell between the good and
excellent quality in only one item (Work Environment), between the
minimal and
good range in four areas (Qualifications and Professional Development, Recordkeeping, Provider-Family Communication, and Marketing and Community Relations), and below
minimal quality in five items (Income and Benefits, Fiscal Management, Risk Management, Family Support and Engagement, and Provider as Employer).
A CLOSER LOOK AT CURRENT PRACTICES
The average BAS score of 3.26 places FCC business and professional practices slightly above minimal quality, suggesting there are great strides to be made in supporting FCC professionals as business owners. Previous literature has suggested a number of specific areas that may be especially pertinent to the decline in FCC (Bromer & Porter., 2019; Bromer et al., 2021; National Center on Early Childhood Quality Assurance, 2020; Vieira & Hill, 2019). And while the average BAS score offers an overarching sense of the current state, a deeper examination of individual quality indicators will no doubt provide the field with much-needed details on the status of specific business and professional practices. To further explore this point, we selected three specific items within the BAS (i.e., Qualifications and Professional Development, Income and Benefits, and Fiscal Management) to examine at the indicator level.
QUALIFICATIONS AND PROFESSIONAL DEVELOPMENT
One of the many factors suggested to contribute to the decline in FCC is a lack of business expertise (Bromer & Porter, 2019; Bromer et al., 2021; National Center on Early Childhood Quality Assurance, 2020; Vieira & Hill, 2019). Item 1 in the BAS, Provider Qualifications and Professional Development, includes information regarding the provider’s level of formal education, specialized ECE/CD coursework, and hours of professional development in business or management training. In our national sample, 60% of FCC providers had at least some college coursework, and 32% had a minimum of a bachelor’s degree. Further, 81% had a minimum of six semester hours of ECE/CD coursework or a current CDA or Montessori credential, and 48% had a minimum of 24 semester hours of college credit in ECE/CD coursework. Comparatively, our sample seems to suggest a promising increase in bachelor’s degrees compared to 17.9% in 2019 (Datta et al., 2021).
Our data showed FCC providers as strongly committed to ongoing professional development, with 81% having attended 15 or more and 56% having attended 30 or more hours of professional development during the last calendar year. The majority of our sample was also connected to other FCC professionals, with 61% demonstrating membership in a formal network or FCC association.
With regards to professional development targeting business and management, our sample showed that throughout their lifetimes, 15% of providers had not attended any business or management training or coursework; however, 66% of providers had at least 15 clock hours of professional development in business or management. While the percentage of providers in our sample with training specific to business or management was over 50%, 15 clock hours of training is unlikely to meet the vast amount of knowledge and skills needed to promote the success of a small business.
Despite understanding the importance of business knowledge and skills, many providers still face substantial challenges in this area (Vieira & Hill, 2017; Kelton, 2020; Zeng et al., 2020). Importantly, research has demonstrated that targeted professional development related to small business and administrative practices leads to significant improvements in provider self-efficacy, commitment to the field, business practices, and increased income (Kelton, 2020; Vieira & Hill, 2019; Zeng et al., 2020). For example, Vieira and Hill (2019) found a 93% increase in income for providers who participated in a one-on-one business coaching program. Kelton (2020) found statistically significant increases in provider perceived knowledge and skills, statistically significant gains in BAS scores, and increased engagement in quality improvement initiatives and professional growth activities for providers who participated in a 9-month leadership academy.
INCOME AND BENEFITS
The National Center on Early Childhood Quality Assurance (2020) points to compensation and benefits, as well as business operation factors, as two reasons for the decline in FCC programs nationwide. While the early care and education sector, in general, is considered to be low-earning, FCC providers, in particular, struggle. Low and erratic income, as well as a lack of benefits, are often highlighted as strong contributors to the decline in FCC programs (National Center on Early Childhood Quality Assurance, 2020; Vieira & Hill, 2019).
Item 2 in the BAS examines income and benefits. Our sample showed that 30% of FCC programs had not increased or added any new fees within the past three years, and only 25% of programs had increased or added a new fee in each of the past three years. It is important to highlight that a provider does not have to raise tuition rates in order to receive credit for these indicators; they could increase any fee (e.g., late pick-up fee, registration fee, field trip fee, etc.) or introduce any new fee (Talan & Bloom, 2018). The lack of new or increased fees is particularly alarming given that the cost of living and conducting business continued to increase yearly between 2018 and 2023, with inflation rates averaging as high as 8.4% in 2022 (Child Care Aware, 2023). Moreover, state subsidy reimbursement rates for 2024 are set to be at or above the 75th percentile of the true market rate for preschoolers in only four states (Coffey, 2023).
The cost of family child care is typically less than that of center-based care, and while the reduced cost of enrolling in a FCC program may make FCC a more affordable option for many families, it also represents an ECEC “system that is built at the expense of the early childhood workforce” (Workman, 2021, p5). FCC professionals may be less likely to increase fees than center directors out of empathy towards the families or out of fear that families will enroll their children in less expensive care options. However, if FCC programs do not have business practices in place to increase revenues to offset the costs of doing business, the financial stability of the program is at risk.
Along with information on ways to increase income, Item 2 in the BAS looks at professional benefits. Our data showed that 19% of FCC providers do not receive at least six paid holidays per year. Yet41% do receive at least 16 days of paid time off (inclusive of paid holidays, vacation, professional development, and sick leave). On average, US workers receive eight days of paid sick time, 7.6 paid holidays, and 11 days of paid vacation time per year (Baluch & Bottorff, 2023). With regards to other benefits, our sample also showed that 11% of FCC providers do not have health insurance, and an alarming 64% had not contributed to a qualified retirement plan within the past 12 months. In order to attract and retain a strong workforce, the FCC profession needs to include access to benefits such as paid time off, health insurance, and retirement plans (Gerstenblatt et al., 2014; Vieira & Hill, 2019).
FISCAL MANAGEMENT
Item 4 in the BAS examines fiscal management practices. Sound fiscal management practices are essential to the financial sustainability of a program. Our data showed that 18% of programs did not review their accounting records, and only 60% reviewed accounting records monthly. When a business does not track income and expenses, it is hard to determine its true costs and profitability. Additionally, without knowing the costs and profit margin for the business, it is difficult to price child care services appropriately.
An operating budget is a critical component of operating a business. Our data showed that 66% of FCC programs had no current operating budget, and only 25% had a budget that projected a profit. A budget allows a program to set measurable financial goals, determine spending caps, and monitor progress. Without a plan in place, business profit or losses are left up to chance.
CONCLUSION
The opportunity to own and operate one’s own FCC business has many advantages, including role autonomy, financial independence, and the ability to work from home. FCC programs, however, have been experiencing an alarming decline in numbers. Small business ownership and entrepreneurship are foundational to FCC, and yet they receive little attention both in the research literature and in the supports offered to FCC providers (Bromer et al., 2021; Fernandez et al., 2018; Garner & McCarron, 2022; Gerstenblatt et al., 2014). While research has begun to hypothesize the critical role that sound business and professional practices play in a FCC program’s success and sustainability, there is limited data informing the current status of such practices across FCC programs.
Although descriptive in nature, this study offers a window into the current quality of business and professional practices across a large national sample of FCC programs. This research offers insight into specific areas to offer targeted support and professional development that can build FCC providers’ small business knowledge and entrepreneurial skills. Efforts aimed to educate providers on effective fiscal management practices, as well as advocacy efforts to increase income and access to benefits (from both private and public funding sources), appear to be two such avenues for targeted support.
REFERENCES
Baluch, A. & Bottorff, C. (2023, March 30). Average PTO In the US and other PTO statistics (2024). Forbes. https://www.forbes.com/advisor/business/pto-statistics/
Belfield, C. (2023). Child care and working families: A post-pandemic economic analysis for the U.S. Technical Report. StrongNation. https://www.strongnation.org/articles/2038-122-billion-the-growing-annual-cost-of-the-infant-toddler-child-care-crisis
Bishop, S. (2023). $122 Billion: The growing, annual cost of the infant-toddler child care crisis. ReadyNation. https://www.strongnation.org/articles/2038-122-billion-the-growing-annual-cost-of-the-infant-toddler-child-care-crisis
Bromer, J. & Porter, T.B. (2019). Mapping the Family Child Care Network Landscape: Findings from the National Study of Family Child Care Networks. Herr Research Center, Erikson Institute.
Bromer, J., Porter, T., Jones, C., Ragonese-Barnes, M., & Orland, J. (2021). Quality in home-based child care: A review of selected literature. OPRE Report # 2021-136, Office of Planning, Research, and Evaluation, Administration for Children and Families, U.S. Department of Health and Human Services. https://www.erikson.edu/wp-content/uploads/2021/10/HBCCSQ_LitReviewExecSumm_2021-Remediated.pdf
Coffey, M. (2023, March). States can improve child care assistance programs through cost modeling. American Progress. https://www.americanprogress.org/article/states-can-improve-child-care-assistance-programs-through-cost-modeling/
Coffey, M. & Khattar, R. (2022). The child care sector will continue to struggle hiring staff unless it creates good jobs. Center for American Progress. https://www.americanprogress.org/article/the-child-care-sector-will-continue-to-struggle-hiring-staff-unless-it-creates-good-jobs/
Child Care Aware of America. (2022). Annual child care landscape analysis. Child Care Aware of America. https://www.childcareaware.org/catalyzing-growth-using-data-to-change-child-care-2022/#LandscapeAnalysis
Datta, A.R., Milesi, C., Srivastava, S., & Zapata-Gietl, C. (2021). NSECE chartbook – Home-based early care and education providers in 2012 and 2019: Counts and characteristics. OPRE Report No. 2021-85, Washington DC: Office of Planning, Research and Evaluation, Administration for Children and Families, U.S. Department of Health and Human Services. https://www.acf.hhs.gov/sites/default /files/documents/opre/NSECE-chartbook-homebased-may-2021.pdf
Flynn, S. (2023, November 2). U.S. child care crisis is holding back the workforce. Forbes. https://www.forbes.com/sites/mariaflynn/2023/11/02/us-child-care-crisis-is-holding-back-the-workforce/?sh=be0198d5bfe8
Fernandez, J., Mootoo, C.J., Romero, S., & Rasmussen, A. (2018). Role conflict among family childcare providers in the Bronx. Children and Society, 32 470-480.
Gerstenblatt, P., Faulkner, M., Lee, A., Doan, L. T., Travis, D. (2014). Not babysitting: Work stress and well-being for family child providers. Early Childhood Education, 42, 67-75.
Henly, J. R., & Adams, G. (2019). Addressing the decreasing number of family child care providers in the United States. National Center on Early Childhood Quality Assurance https://childcareta.acf.hhs. gov/sites/default/files/public/addressing_ decreasing_fcc_providers_september2020_final.pdf
Kelton, R., Talan, T., & Bloom, P.J. (2014). Alternative pathways to quality in family child care quality rating and improvement systems. Early Childhood Research and Practice, 15(2).
Kelton, R. (2020). Taking the Lead: Investing in family child care. Research Notes. McCormick Center for Early Childhood Leadership at National Louis University. https://mccormickcenter.nl.edu/library/taking-the-lead/
National Center on Early Childhood Quality Assurance. (2020). Addressing the decline in family child care. Administration for Children and Families, Office of Child Care. https://childcareta .acf.hhs.gov/sites/default/files/addressing_decreasing_fcc_providers_revised_march2020_final.pdf
National Center on Early Childhood Quality Assurance (2015). State policies that support business practices of child care providers. U.S Department of Health and Human Services, Administration for Children and Families, Office of Head Start, Office of Child Care, and Health Resources and Services Administration. https://childcareta.acf.hhs.gov/resource/state-policies-support-business-practices-child-care-providers
National Survey of Early Care and Education Project Team. (2016). Characteristics of home-based early care and education providers: Initial findings from the National Survey of Early Care and Education. OPRE Report #2016-13. Office of Planning, Research and Evaluation, Administration for Children and Families, U.S. Department of Health and Human Services. https://www.acf.hhs.gov/sites/default/files/documents/opre/characteristics_of_home_based_early_care_and_education_toopre_032416.pdf
National Center on Early Childhood Quality Assurance. (2017). Developing and revising child care licensing requirements. Office of Child Care.
Porter, T., Paulsell, D., Del Grosso, P., Avellar, S. A., Hass, R., & Vuong, L. (2010). A review of the literature on home-based child care: Implications for future directions. Mathematica Policy Research. https://www.acf.hhs.gov/opre/report/review-literature-home-based-child-care-implications-future-directions-final
Stoney, L., & Blank, S. (2011). Delivering quality: Strengthening the business side of early care and education. Opportunities Exchange. https://childcareta.acf.hhs.gov/sites/default/files/new-occ/resource/files/delivering_quality_strengthening_the_business_side_of_ece.pdf
Talan, T., & Jorde Bloom, P. (2018). Business Administration Scale for Family Child Care (2nd ed). Teachers College Press.
Vieira, N. & Hill. S. (2017). Creating the conditions for family child care to thrive. All Our Kin. CT. https://allourkin.org/files/galleries/Family_Child_Care_to_Thrive.pdf
Workman, S., (2021, June 28). The true cost of high-quality child care across the United States. Center for
American Progress. https://www.americanprogress.org/article/true-cost-high-quality-child-care-across-united-states/
Zeng, S., Douglass, A., Lee, Y., & Delvecchio, B. (2021). Preliminary efficacy and feasibility of a business
leadership training program for small child care providers. Early Childhood Education Journal, 49, 27-36.


