Stark Contrast between Early Childhood Program Directors and Elementary School Principals

A woman wearing glasses and a suit is smiling in front of a flag.

Sim Loh is a family partnership coordinator at Children’s Village, a nationally-accredited Keystone 4 STARS early learning and school-age enrichment program in Philadelphia, Pennsylvania, serving about 350 children. She supports children and families, including non-English speaking families of immigrant status, by ensuring equitable access to education, health, employment, and legal information and resources on a day-to-day basis. She is a member of the Children First Racial Equity Early Childhood Education Provider Council, a community member representative of Philadelphia School District Multilingual Advisory Council, and a board member of Historic Philadelphia.


Sim explains, “I ensure families know their rights and educate them on ways to speak up for themselves and request for interpretation/translation services. I share families’ stories and experiences with legislators and decision-makers so that their needs are understood. Attending Leadership Connections will help me strengthen and grow my skills in all domains by interacting with and hearing from experienced leaders in different positions. With newly acquired skills, I seek to learn about the systems level while paying close attention to the accessibility and barriers of different systems and resources and their impacts on young children and their families.”

This document may be printed, photocopied, and disseminated freely with attribution. All content is the property of the McCormick Center for Early Childhood Leadership.

This resource is part of our Research Notes series.


Two new tools that provide information about early childhood leadership were launched this summer. Concurrent with the development and release of the McCormick Center’s L.E.A.D. Early Childhood Clearinghouse,1 New America created a data visualization tool, the Pre-K Leader Policy Scan.2 Both organizations collaborated on data collection and analysis to reduce duplication and serve stakeholders with comprehensive interactive websites. They also published research reports that drew from the rich and extensive data found within the tools.


New America’s report, A Tale of Two Pre-K Leaders: How State Policies for Center Directors and Principals Leading Pre-K Programs Differ, and Why They Shouldn’t,3 written by Abbie Lieberman, highlights the contrast between the qualifications for early childhood program directors and those of elementary school principals. Lieberman found that standards for center directors were much lower than those of elementary school principals even though the requirements for their jobs were similar. While this finding is not surprising, the report comprehensively demonstrates a pervasive gap between the child care and public school sectors.


DATA COLLECTION


As a framework for assessing the pre-K leadership landscape, New America looked to “Knowledge and Competencies for Leadership in Settings with Children Birth Through Age 8” in the Institute of Medicine and National Research Council report, Transforming the Workforce for Children Birth Through Age 8: A Unifying Foundation.4 Several of these competencies align with the Whole Leadership Framework5 including teaching practices that help children learn, authentic child assessment, fostering a professional workforce, meaningful appraisal of teachers’ performance, strong community partnerships, and organizational development. These competencies point to the similarity of what is required of administrators in both child care centers and pre-K-12 schools.


New America’s Early & Elementary Education Policy team conducted a 50-state survey of departments of education (DOE) and a few state elementary school principal associations to scan the policy landscape of elementary school principals. They partnered with the McCormick Center, who collected data on early childhood center directors by examining source documents on state policies and surveying various state departments (other than DOE) for certain indicators. To more deeply understand leaders’ roles, challenges, professional preparation, and supports, New America interviewed center directors and principals across the country giving voice to their perspectives.


RESULTS


Four aspects of pre-K leadership were examined in the New America study: pre-service requirements, in-service requirements, compensation and retention, and leader diversity. New America noted the challenges of collecting data within the two sectors and the complexity of data systems, particularly in the child care sector. The report examined states’ pre-service requirements for principals with six indicators:


  • Minimum education requirements
  • Grade span of the principal’s license
  • Coursework around early learning and/or child development
  • Prior teaching experience – number of years
  • Prior teaching experience – grades taught
  • Clinical experiences in preparation programs


The study looked at pre-service requirements for center directors with four indicators:


  • Education requirements in licensing standards
  • Experience requirements in licensing standards
  • State-recognized center director credentials
  • Director credentials required in licensing standards


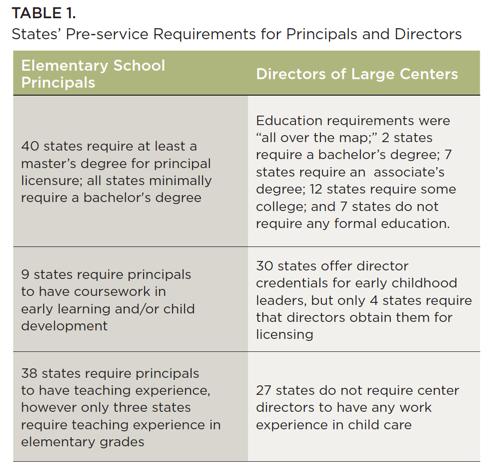
Pre-service requirements of principals were significantly higher than those of center directors. However, most states are slow to establish policies that require principals to acquire leadership knowledge and skills specific to pre-K children. Researchers found that licensing standards for center directors were inconsistent across the states and lacked rigor. Table 1 shows some highlights from the report that demonstrate the contrast between elementary school principals and child care center directors.


New America included case studies of innovative professional learning opportunities for principals, with a focus on pre-K to 3rd grade alignment. Twelve states reported having similar programs for principals. The report also highlighted professional development through tiered quality rating and improvement systems (QRIS) for child care center directors. Researchers noted that in all states, principals were required to have formal performance reviews, but no state system exists to ensure formal evaluation of center directors.

Table 1 states pre-service requirements for principals and directors

Findings were presented on compensation and retention from states where data were available. The disparity of average salaries across sectors were particularly acute. The average salary for elementary school principals was $90,410 (range $67,890 – $124,560), while that of center directors was $52,760 (range $39,190 – $68,180). Turnover for both principals and center directors was reported to be high.


New America found that 80 percent of principals were white; however, racial statistics were not available specifically for center directors. The Center for the Study of Child Care Employment reports that the overall child care workforce is more ethnically diverse than K-12 teachers. No states reported initiatives to increase the diversity of school principals or center directors.


RECOMMENDATIONS


New America recommended that states would benefit from recognizing the similarities that exist in the roles of child care and elementary school administrators. Cross-sector professional learning opportunities where principals and center directors could build relationships and coordinate efforts would help children and families as they transition along the pre-K to 3rd grade education continuum. The report put forth the following recommendations:


For Elementary School Principals


  • Embed early childhood education throughout principal preparation courses.
  • Require teaching experience or clinical experience specifically in elementary schools.
  • Offer ongoing professional learning opportunities on early education.
  • Track principal turnover and salaries and use the data to determine how districts can better support leaders.


For Pre-K Center Directors


  • Increase center director qualifications to reflect the research on child development and early learning.
  • Increase infrastructure for child care to improve center director well-being and retention.
  • Increase center directors’ opportunities for professional learning.
  • Streamline state regulations and eliminate redundancies.


REFERENCES


  1. http://mccormickcenter.nl.edu/lead/closing-the-leadership-gap/
  2. https://www.newamerica.org/in-depth/pre-k-leaders/
  3. The report carries a Creative Commons Attribution 4.0 International license; full legal code at creativecommons.org.
  4. Institute of Medicine (IOM) and National Research Council (NRC) (2015). Transforming the Workforce for Children Birth Through Age 8: A Unifying Foundation (Washington, DC: National Academies Press, 344–345).
  5. Abel, M. B., Talan, T. N., & Masterson, M. (2017, Jan/Feb). Whole leadership:A framework for early childhood programs. Exchange, 39 (233), 22–25.
By McCormick Center May 13, 2025
Leaders, policymakers, and systems developers seek to improve early childhood programs through data-driven decision-making. Data can be useful for informing continuous quality improvement efforts at the classroom and program level and for creating support for workforce development at the system level. Early childhood program leaders use assessments to help them understand their programs’ strengths and to draw attention to where supports are needed.  Assessment data is particularly useful in understanding the complexity of organizational climate and the organizational conditions that lead to successful outcomes for children and families. Several tools are available for program leaders to assess organizational structures, processes, and workplace conditions, including: Preschool Program Quality Assessment (PQA) 1 Program Administration Scale (PAS) 2 Child Care Worker Job Stress Inventory (ECWJSI) 3 Early Childhood Job Satisfaction Survey (ECJSS) 4 Early Childhood Work Environment Survey (ECWES) 5 Supportive Environmental Quality Underlying Adult Learning (SEQUAL) 6 The Early Education Essentials is a recently developed tool to examine program conditions that affect early childhood education instructional and emotional quality. It is patterned after the Five Essentials Framework, 7 which is widely used to measure instructional supports in K-12 schools. The Early Education Essentials measures six dimensions of quality in early childhood programs: Effective instructional leaders Collaborative teachers Supportive environment Ambitious instruction Involved families Parent voice A recently published validation study for the Early Education Essentials 8 demonstrates that it is a valid and reliable instrument that can be used to assess early childhood programs to improve teaching and learning outcomes. METHODOLOGY For this validation study, two sets of surveys were administered in one Midwestern city; one for teachers/staff in early childhood settings and one for parents/guardians of preschool-aged children. A stratified random sampling method was used to select sites with an oversampling for the percentage of children who spoke Spanish. The teacher surveys included 164 items within 26 scales and were made available online for a three-month period in the public schools. In community-based sites, data collectors administered the surveys to staff. Data collectors also administered the parent surveys in all sites. The parent survey was shorter, with 54 items within nine scales. Rasch analyses was used to combine items into scales. In addition to the surveys, administrative data were analyzed regarding school attendance. Classroom observational assessments were performed to measure teacher-child interactions. The Classroom Assessment Scoring System TM (CLASS) 9 was used to assess the interactions. Early Education Essentials surveys were analyzed from 81 early childhood program sites (41 school-based programs and 40 community-based programs), serving 3- and 4-year old children. Only publicly funded programs (e.g., state-funded preschool and/or Head Start) were included in the study. The average enrollment for the programs was 109 (sd = 64); 91% of the children were from minority backgrounds; and 38% came from non-English speaking homes. Of the 746 teacher surveys collected, 451 (61%) were from school-based sites and 294 (39%) were from community-based sites. There were 2,464 parent surveys collected (59% school; 41% community). About one-third of the parent surveys were conducted in Spanish. Data were analyzed to determine reliability, internal validity, group differences, and sensitivity across sites. Child outcome results were used to examine if positive scores on the surveys were related to desirable outcomes for children (attendance and teacher-child interactions). Hierarchical linear modeling (HLM) was used to compute average site-level CLASS scores to account for the shared variance among classrooms within the same school. Exploratory factor analysis was performed to group the scales. RESULTS The surveys performed well in the measurement characteristics of scale reliability, internal validity, differential item functioning, and sensitivity across sites . Reliability was measured for 25 scales with Rasch Person Reliability scores ranging from .73 to .92; with only two scales falling below the preferred .80 threshold. The Rasch analysis also provided assessment of internal validity showing that 97% of the items fell in an acceptable range of >0.7 to <1.3 (infit mean squares). The Teacher/Staff survey could detect differences across sites, however the Parent Survey was less effective in detecting differences across sites. Differential item functioning (DIF) was used to compare if individual responses differed for school- versus community-based settings and primary language (English versus Spanish speakers). Results showed that 18 scales had no or only one large DIF on the Teacher/Staff Survey related to setting. There were no large DIFs found related to setting on the Parent Survey and only one scale that had more than one large DIF related to primary language. The authors decided to leave the large DIF items in the scale because the number of large DIFs were minimal and they fit well with the various groups. The factor analysis aligned closely with the five essentials in the K-12 model . However, researchers also identified a sixth factor—parent voice—which factored differently from involved families on the Parent Survey. Therefore, the Early Education Essentials have an additional dimension in contrast to the K-12 Five Essentials Framework. Outcomes related to CLASS scores were found for two of the six essential supports . Positive associations were found for Effective Instructional Leaders and Collaborative Teachers and all three of the CLASS domains (Emotional Support, Classroom Organization, and Instructional Support). Significant associations with CLASS scores were not found for the Supportive Environment, Involved Families, or Parent Voice essentials. Ambitious Instruction was not associated with any of the three domains of the CLASS scores. Table 1. HLM Coefficients Relating Essential Scores to CLASS Scores (Model 1) shows the results of the analysis showing these associations. Outcomes related to student attendance were found for four of the six essential supports . Effective Instructional Leaders, Collaborative Teachers, Supportive Environment, and Involved Families were positively associated with student attendance. Ambitious Instruction and Parent Voice were not found to be associated with student attendance. The authors are continuing to examine and improve the tool to better measure developmentally appropriate instruction and to adapt the Parent Survey so that it will perform across sites. There are a few limitations to this study that should be considered. Since the research is based on correlations, the direction of the relationship between factors and organizational conditions is not evident. It is unknown whether the Early Education Essentials survey is detecting factors that affect outcomes (e.g., engaged families or positive teacher-child interactions) or whether the organizational conditions predict these outcomes. This study was limited to one large city and a specific set of early childhood education settings. It has not been tested with early childhood centers that do not receive Head Start or state pre-K funding. DISCUSSION The Early Education Essentials survey expands the capacity of early childhood program leaders, policymakers, systems developers, and researchers to assess organizational conditions that specifically affect instructional quality. It is likely to be a useful tool for administrators seeking to evaluate the effects of their pedagogical leadership—one of the three domains of whole leadership. 10 When used with additional measures to assess whole leadership—administrative leadership, leadership essentials, as well as pedagogical leadership—stakeholders will be able to understand the organizational conditions and supports that positively impact child and family outcomes. Many quality initiatives focus on assessment at the classroom level, but examining quality with a wider lens at the site level expands the opportunity for sustainable change and improvement. The availability of valid and reliable instruments to assess the organizational structures, processes, and conditions within early childhood programs is necessary for data-driven improvement of programs as well as systems development and applied research. Findings from this validation study confirm that strong instructional leadership and teacher collaboration are good predictors of effective teaching and learning practices, evidenced in supportive teacher-child interactions and student attendance. 11 This evidence is an important contribution to the growing body of knowledge to inform embedded continuous quality improvement efforts. It also suggests that leadership to support teacher collaboration like professional learning communities (PLCs) and communities of practice (CoPs) may have an effect on outcomes for children. This study raises questions for future research. The addition of the “parent voice” essential support should be further explored. If parent voice is an essential support why was it not related to CLASS scores or student attendance? With the introduction of the Early Education Essentials survey to the existing battery of program assessment tools (PQA, PAS, ECWJSI, ECWES, ECJSS and SEQUAL), a concurrent validity study is needed to determine how these tools are related and how they can best be used to examine early childhood leadership from a whole leadership perspective. ENDNOTES 1 High/Scope Educational Research Foundation, 2003 2 Talan & Bloom, 2011 3 Curbow, Spratt, Ungaretti, McDonnell, & Breckler, 2000 4 Bloom, 2016 5 Bloom, 2016 6 Whitebook & Ryan, 2012 7 Bryk, Sebring, Allensworth, Luppescu, & Easton, 2010 8 Ehrlich, Pacchiano, Stein, Wagner, Park, Frank, et al., 2018 9 Pianta, La Paro, & Hamre, 2008 10 Abel, Talan, & Masterson, 2017 11 Bloom, 2016; Lower & Cassidy, 2007 REFERENCES Abel, M. B., Talan, T. N., & Masterson, M. (2017, Jan/Feb). Whole leadership: A framework for early childhood programs. Exchange(19460406), 39(233), 22-25. Bloom, P. J. (2016). Measuring work attitudes in early childhood settings: Technical manual for the Early Childhood Job Satisfaction Survey (ECJSS) and the Early Childhood Work Environment Survey (ECWES), (3rd ed.). Lake Forest, IL: New Horizons. Bryk, A. S., Sebring, P. B., Allensworth, E., Luppescu, S., & Easton, J. Q. (2010). Organizing schools for improvement: Lessons from Chicago. Chicago, IL: The University of Chicago Press. Curbow, B., Spratt, K., Ungaretti, A., McDonnell, K., & Breckler, S. (2000). Development of the Child Care Worker Job Stress Inventory. Early Childhood Research Quarterly, 15, 515-536. DOI: 10.1016/S0885-2006(01)00068-0 Ehrlich, S. B., Pacchiano, D., Stein, A. G., Wagner, M. R., Park, S., Frank, E., et al., (in press). Early Education Essentials: Validation of a new survey tool of early education organizational conditions. Early Education and Development. High/Scope Educational Research Foundation (2003). Preschool Program Quality Assessment, 2nd Edition (PQA) administration manual. Ypsilanti, MI: High/Scope Press. Lower, J. K. & Cassidy, D. J. (2007). Child care work environments: The relationship with learning environments. Journal of Research in Childhood Education, 22(2), 189-204. DOI: 10.1080/02568540709594621 Pianta, R. C., La Paro, K. M., & Hamre, B. K. (2008). Classroom Assessment Scoring System (CLASS). Baltimore, MD: Paul H. Brookes Publishing Co. Talan, T. N., & Bloom, P. J. (2011). Program Administration Scale: Measuring early childhood leadership and management (2 nd ed.). New York, NY: Teachers College Press. Whitebook, M., & Ryan, S. (2012). Supportive Environmental Quality Underlying Adult Learning (SEQUAL). Berkeley, CA: Center for the Study of Child Care Employment, University of California.
Show More