Quality Improvement in Program Administration through Directors’ Support Cohorts

A woman wearing glasses and a suit is smiling in front of a flag.

Sim Loh is a family partnership coordinator at Children’s Village, a nationally-accredited Keystone 4 STARS early learning and school-age enrichment program in Philadelphia, Pennsylvania, serving about 350 children. She supports children and families, including non-English speaking families of immigrant status, by ensuring equitable access to education, health, employment, and legal information and resources on a day-to-day basis. She is a member of the Children First Racial Equity Early Childhood Education Provider Council, a community member representative of Philadelphia School District Multilingual Advisory Council, and a board member of Historic Philadelphia.


Sim explains, “I ensure families know their rights and educate them on ways to speak up for themselves and request for interpretation/translation services. I share families’ stories and experiences with legislators and decision-makers so that their needs are understood. Attending Leadership Connections will help me strengthen and grow my skills in all domains by interacting with and hearing from experienced leaders in different positions. With newly acquired skills, I seek to learn about the systems level while paying close attention to the accessibility and barriers of different systems and resources and their impacts on young children and their families.”

This document may be printed, photocopied, and disseminated freely with attribution. All content is the property of the McCormick Center for Early Childhood Leadership.

This resource is part of our Research Notes series. 


Initiatives to improve administrative practices in early childhood programs take many forms. Some models are high-intensity, providing substantial external support for directors—formal training leading to an advanced degree, high dosage of technical support for achieving accreditation, and on-site coaching addressing multiple facets of program leadership and management. These high-intensity models have been shown to yield significant improvements in program- and classroom-level quality, organizational climate, and participants’ level of knowledge and demonstrated skill.1


Other models are moderate-intensity, providing a lower dose of formal training and on-site support, and lead to a director credential. Although the outcomes are not as robust as the high-intensity models, moderate-intensity initiatives also yield significant improvements in program quality and directors’ level of competency.2


Because high- and moderate-intensity initiatives are costly to implement, the current study examined an informal low-intensity approach to strengthening leadership capacity as a viable alternative.


THE MODEL


Beginning in 2006, the Metropolitan Council on Early Learning (MCEL), a program of the Mid-America Regional Council in Kansas City, offered a director support program with the following characteristics:


  • Programs were assessed using the Program Administration Scale (PAS) to identify areas of administrative practice in need of improvement.3
  • Facilitated cohort groups of directors met monthly for networking and peer support.
  • Some training was offered to enhance leadership and management skills.
  • Some coaching was provided to help directors develop and implement their program improvement plans.4
  • Print and electronic resource materials were provided.


SAMPLE AND METHODS


Twenty-nine early childhood directors participated in two cohorts of the MCEL Director Support Program. Twenty-three participants (79%) completed the 18-month intervention. Participants in the sample were not highly qualified. Only one director had an advanced degree. More than half had not achieved an associate’s degree with 21 s.h. of college credit in ECE/CD and 9 s.h. in management coursework.


Participants were selected to represent a variety of early childhood centers in the Kansas City bi-state area. On average, the centers had a license capacity of 88 with 16 staff members. Fourteen programs (61%) were private nonprofit; 7 programs (30%) were private for-profit; and 2 (9%) were public programs. Three programs received Head Start funding. Nearly half of the centers (48%) were accredited.


Pre- and post-intervention assessments were conducted by independent certified PAS assessors.Paired sample t-tests were performed to assess change over time for each center’s overall PAS score and individual PAS items 1 through 21. Staff qualifications were not included in the analysis. Cohen’s d was computed to assess effect size.


RESULTS


On average, the overall PAS scores improved for participants’ programs. There was a significant difference between the pre-intervention PAS scores (M = 2.87, SD =1.06) and the post-intervention scores (M = 3.47, SD = 1.14, t = 3.07, p < .01, Cohen’s d = .54) indicating a medium effect.


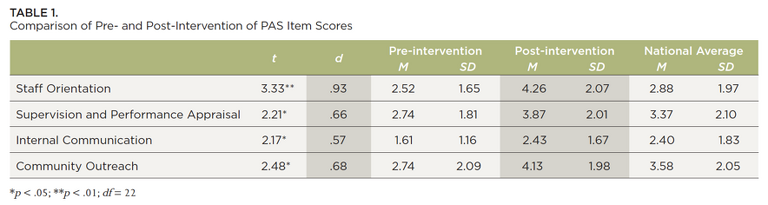
The average PAS scores for these items were compared to the national averages obtained from the normative samples in developing the PAS. Study participants scored lower than the national average when they began meeting with other directors. By the end of the study, the average scores for these items exceeded the national means.


Significant differences were also found in four of the individual PAS items as seen in Table 1.

A table showing the comparison of pre and post intervention of fas scores

DISCUSSION


The results of this study suggest that an informal low-intensity model may be a cost-effective means for yielding moderate positive outcomes in the administrative practices in early care and education programs.


Utilizing an assessment tool of leadership and management practices like the PAS provides structure and standards to guide directors, coaches, and peer mentors in identifying specific areas of strength and areas in need of improvement. A learning community offers a venue for discussing specific aspects of leadership and management practice and for exploring practical solutions to issues that directors experience.


Multiple intervention strategies were incorporated in this model including facilitated peer learning groups that met quarterly, two targeted training sessions per cohort, monthly coaching contacts to develop and execute improvement plans, and support with resources and formal education.6 The training topics emerged from the peer learning groups based on the initial PAS results and participants’ perceived needs. Coaches helped directors interpret PAS scores as well as understand the value of implementing management practices, documentation, and organizing materials and records.


Results suggest that the model may be more effective with certain dimensions of early childhood program administration than others. The large effect size (.93) for improvement in the PAS item assessing staff orientation practices indicates it was especially impacted by this initiative. Moderate effects were also seen in supervision and performance appraisal, internal communication, and community outreach. These aspects of leadership and management can be readily adjusted by program directors, which may explain why the effects are more significant than for other areas that involve many individuals affiliated with the organization.


Many state leaders overseeing early childhood quality initiatives are considering how to take successful program models to scale or how to sustain advances made in statewide systems. Initiatives implementing a facilitated peer learning model for improvement in administrative practices may offer cost-effective features that could be incorporated into larger system initiatives such as QRIS. Participant cost data was not available for this study, but the intervention model using peer supports may be more feasible than other models that incorporate extensive formal training.


There are several limitations to this study that should be considered in interpreting the results. Caution should be exercised in generalizing the results due to the small sample size. Multiple aspects of the intervention model were not evaluated independently requiring further research to determine which strategies most contribute to its effectiveness. Its applicability to other agencies and in diverse communities is also unknown, although other low-intensity leadership training programs have reported similar results. The results of this study suggest that additional research on the intensity of professional development for early childhood administrators is warranted.


  1. Bloom, P. J., & Sheerer, M. (1992). The effect of leadership training on program quality. Early Childhood Research Quarterly, 7(4), 579-594.
  2. Bloom, P. J., Jackson, S., Talan, T. N., & Kelton, R. (2013). Taking Charge of Change: A 20-year review of empowering early childhood administrators through leadership training. Wheeling, IL: McCormick Center for Early Childhood Leadership, National Louis University.
  3. Talan, T. N. & Bloom, P. J. (2004). Program Administration Scale: Measuring early childhood leadership and management. New York: Teachers College Press.
  4. Meeting facilitation, training, and coaching were provided by Francis Institute for Child and Youth Development, located at Metropolitan Community College-Penn Valley.
  5. Assessments were conducted by University of Missouri-Kansas City, Institute for Human Development.
  6. Newkirk, M. K. (2014, January). Improving leadership and management practice in early learning programs through assessment and support. University of Missouri-Kansas City Institute for Human Development.
By Robyn Kelton, M.A. June 27, 2025
INTRODUCTION Turnover rates in child care are among the highest in education, with over 160,000 workforce openings predicted annually (Bassok et al., 2014; Doromal et al., 2022; Joughin, 2021; U.S. Bureau of Labor Statistics, 2025). While some turnover is expected and even necessary, the levels of turnover experienced in the field of early childhood education and care (ECEC) are not only alarmingly high but deeply problematic. In 2021, a national survey conducted by the National Association for the Education of Young Children found that over 80% of child care centers were experiencing a staffing shortage, with the majority of those programs reporting one-to-five open roles, but 15% reporting between six and 15 open roles (NAEYC, 2021). Staffing shortages result in lost revenue, financial uncertainty, and program instability, often forcing administrators to operate below capacity and/or under reduced hours (NAEYC, 2021; NAEYC, 2024; Zero to Three, 2024). Limited enrollment slots and classroom and program closures lead to increased waiting lists (Zero to Three, 2024; Carrazana, 2023). In turn, families are placed in a highly vulnerable position of needing to leave the workforce to stay home with their child or turn to potentially unsafe or unregulated child care. Moreover, increased turnover in classrooms interrupts continuity of care and disrupts the relationships built between children and their educators (Reidt-Parker, J., & Chainski, M. J. (2015). Research has begun to highlight some of the programmatic and personnel characteristics predictive of increased staff turnover in ECEC programs. Low wages are most commonly identified as a strong predictor of turnover (Amadon et al., 2023; Bryant et al., 2023; Fee, 2024; Guevara, 2022; Totenhagen et al., 2016). However, workforce advocates and some researchers have begun to expand conversations on compensation to explore the impact the profession’s general lack of benefits such as paid time off, access to health insurance, and retirement benefits has on retention (e.g., Amadon et al., 2023; Bryant et al., 2023; Fee, 2024; Lucas, 2023). While informative, this body of work has typically approached benefits as binary variables (i.e., have or do not have) rather than reflect the spectrum on which benefits are commonly offered (e.g., the number of days off, the percent of insurance covered by the employer, and levels of retirement matching funds). This Research Note aims to expand on previous work investigating the relationship between benefits and turnover by exploring the possibility of a more nuanced relationship between the variables to determine if the level of benefits offered impacts turnover rates. METHOD This study used data collected via formal Program Administration Scale, 3rd Edition (PAS-3) assessments conducted by Certified PAS-3 Assessors between 2023 and 2025. To become certified, PAS-3 assessors must first achieve reliability (a score of at least 86%) on a test conducted after four days of training on the tool. Next, they must conduct two PAS assessments within three months of reliability training. PAS-3 national anchors reviewed the completed assessments for consistency, accuracy, and completeness. The study analyzed data from 133 PAS-3 assessments collected during the certification process across 12 states, the District of Columbia, and the U.S. Mariana Islands.  Measures Data for this study were collected using the PAS-3, a valid and reliable tool used to measure and improve Whole Leadership practices in center-based programs (Talan, Bella, Jorde Bloom, 2022). The PAS-3 includes 25 items, each composed of 2-5 indicator strands and scored on a 7-point Likert scale (1 = inadequate, 3 = minimal, 5 = good, and 7 = excellent). Item scores are averaged to determine a mean PAS-3 score. Of particular interest to this study is Item 5: Benefits. Item 5 measures employee access to health insurance and considers what percentage of the cost is paid by the employer, the total number of paid time off days within the first and fifth years of employment, access to a retirement plan, and the percentage at which the employer will match the employee’s contribution. Last, Item 5 explores provisions made to cover the costs of staff’s professional development. Non-applicable is allowed as a response for indicators related to health insurance and retirement if there are no full-time staff employed by the program. Sample Program enrollment ranged in size from four children to 285, with a mean enrollment of 65 and a median of 55. Total program staff for the sample ranged from two to 44 staff, with an average of just under 14 staff (13.93) and a standard deviation of 8.80. Table 1 below provides a detailed breakdown of staff by role and full-time and part-time status.
Show More